 Email
Email Print
Print


Adhesive Tapes Market Overview
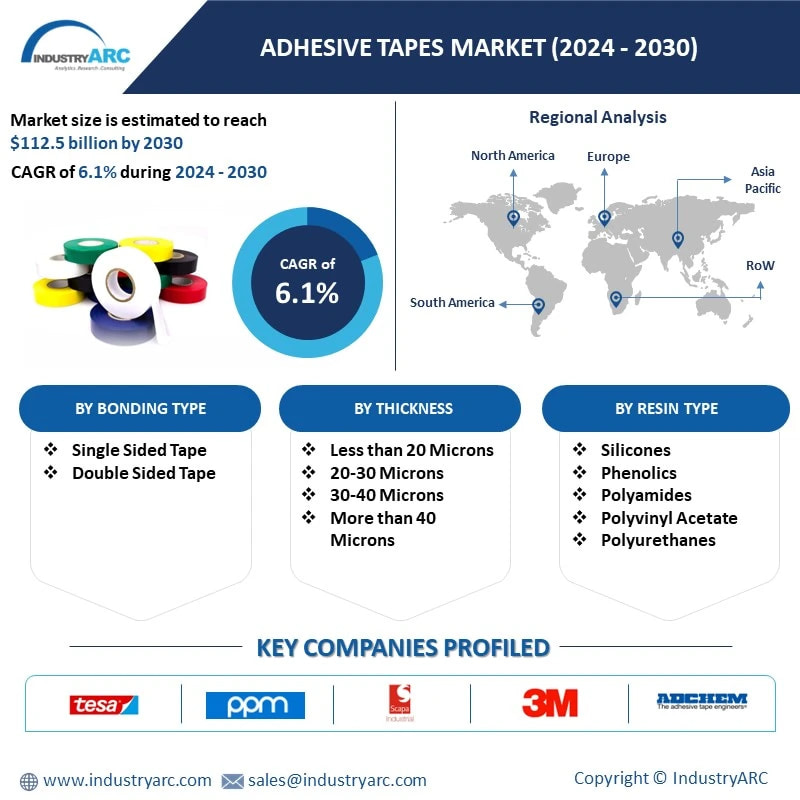
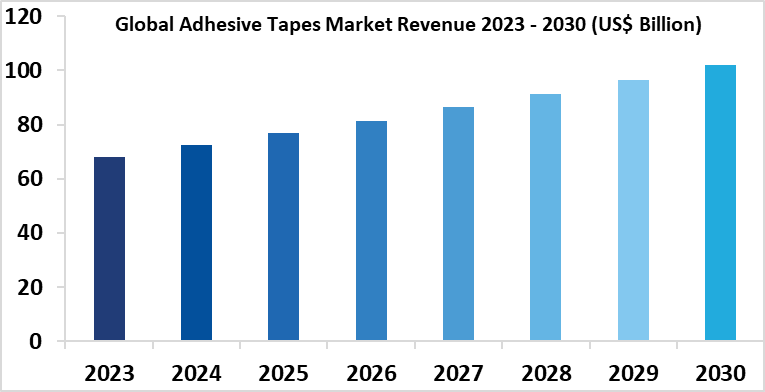
Adhesive Tapes Market size is estimated to be $112.5 billion in 2030 and is forecasted to grow at a CAGR of 6.1% during 2024-2030. Adhesive tape is a material to which adhesives and supporting materials are smeared to bind and assemble objects. The backing material is usually made of polyvinyl chloride, cloth, and paper. The adhesive on the tape is a viscoelastic material that adheres to the pressure applied to it and is generally sensitive to moisture. The major adhesive materials include acrylic adhesives, epoxy resins, and others.
The growth of the healthcare sector is a significant factor contributing to market growth. Adhesive tapes are used in medical equipment assembly, wound care, and cloth adhesion during surgery. In addition, skin-friendly adhesives are widely used in the manufacture of diapers for babies and adults. In addition, the growing demand for sustainable productions such as biodegradable water-based adhesive products have boosted the market growth. The growing trend of online shopping increases the demand for packaging and distribution of goods which has led to an increase in demand for adhesive tapes worldwide.
As consumer awareness towards environmental sustainability grows, the adhesive tape market undergoes a paradigm shift. Manufacturers actively pioneer eco-friendly formulations, ensuring robust bonding capabilities. This commitment aligns with a larger market response to the rising demand for packaging solutions minimizing environmental impact. Additionally, these innovative adhesive tapes not only meet eco-friendly standards but also cater to the evolving preferences of eco-conscious consumers, further propelling market growth. The industry's concerted efforts reflect a dynamic landscape, adapting to consumer values while addressing pressing environmental concerns.
Market Snapshot:
Adhesive Tapes Market COVID-19 Impact
COVID-19 had a significant economic impact on various financial and industrial sectors such as travel and tourism, manufacturing, and aviation. The increase in the number of COVID-19 cases resulted in the closure of trades, economic activity declined, impacting the global economy.
According to the World Health Organization (WHO), there were more than 178 million confirmed cases of COVID-19 since June 2021, and businesses faced revenue losses and chain disruptions due to factory closures and solitary confinement measures. According to the International Monetary Fund (IMF), the global economy declined by 4% by 2020, the largest decline since the Great Depression of the 1930s. This negatively affected the adhesive tapes market. However, the increased e-commerce purchases during COVID-19 accelerated the market growth in 2021.
Report Coverage
The: “Adhesive Tapes Market Report – Forecast (2024-2030)”, by IndustryARC, covers an in-depth analysis of the following segments of the global adhesive tapes industry.
By Bond Type: Temporary, and Permanent.
By Bonding Type: Single Sided, and Double Sided.
By Thickness: Less than 20 Microns, 20-30 Microns, 30-40 Microns, and Above 40 Microns.
By Technology: Water Activated, Heat Activated, Pressure Sensitive Adhesives (PSA), and Others.
By Product Type: Commodity Tapes, Speciality Tapes, and Others.
By Resin Type: Silicones, Phenolics, Polyamides, Polyvinyl Acetate, Polyurethanes, Acrylics, Epoxies, Polysulfide, Butyl, Polyisobutylene, and Others.
By Backing Material: Polypropylene, Polyester, Polyvinylchloride, Cloth, Paper, and Others
By Substrate: Ceramic, Metals, Plastic, Wood, Glass, Paper, and Others
By End-use Industry: Building & Construction [Residential Construction (Independent Homes, Row Homes, Large Apartment Buildings, Others), Commercial Construction (Hospitals & Healthcare Infrastructure, Educational Institutes, Hotels & Restaurants, Banks and Financial Institutions, Airports, Shopping Malls, and Others), Industrial Construction, and Others], Automotive Industry (Passenger Vehicles, Light Commercial Vehicles, and Heavy Commercial Vehicles), Aerospace & Defence, Marine, Locomotives, Healthcare (Wound Dressing, Surgery, Hygiene, Others), Packaging Industry (Food Packaging, Beverage Packaging, Personal Care & Cosmetics Packaging, Medical Packaging, Homecare Packaging, and Other Packaging), Electrical & Electronics (Home Appliance Components, Telecommunication Components, Industrial Electronics Components, and Others), Furniture & Woodworking, Power and Energy (Wind Energy, Oil & Gas, Solar, and Others), Leather Industry, Hygiene and Personal Care, and Others.
By Geography: North America (USA, Canada, and Mexico), Europe (UK, Germany, France, Italy, Netherlands, Spain, Russia, Belgium, and Rest of Europe), Asia-Pacific (China, Japan, India, South Korea, Australia, and New Zealand, Indonesia, Taiwan, Malaysia, and Rest of APAC), South America (Brazil, Argentina, Colombia, Chile, and Rest of South America), Rest of the World (Middle East, and Africa).
Key Takeaways
• The adhesive tapes market is expected to grow at a moderate growth rate over the forecasted period. The major factor driving the market demand is the increased use of adhesives in various end-use industries including packaging and building & construction.
• Asia-Pacific dominated the adhesive tape market and is expected to continue to do so during the forecast period. China is one of the largest markets for adhesive tapes, due to the large production of electronics, and health care products.
• The adhesive tapes market is fragmented at the global level with small scale companies entering the market. The increased number of participants in the industry has positively affected the market value over a period of time. Major players have been competent enough with key strategies adopted to have a better market share at the global level.
For more details on this report - Request for Sample
For More Details on This Report - https://www.industryarc.com/pdfdownload.php?id=15279
Adhesive Tapes Market Segment Analysis – By Adhesive Formulation
Pressure sensitive adhesive tapes held the largest share in the adhesive tapes market in 2023 and is expected to grow at a CAGR of 4.2% during the forecast period.
The growing applications of pressure sensitive adhesive tapes in various industries such as packaging, healthcare, electrical and electronics, automotives, building & construction, and others are expected to drive the market in the coming years. The great demand for PSA tapes and their widespread adoption due to their ease of use and low threat of substitute products in the market. Asia Pacific is one of the key regions contributing to the growth of the pressure sensitive adhesive tapes market since recent years. The strong demand in Asia Pacific regions is a majorly due to increased demand form fast growing emerging economies such as China, Japan, and India owing to increased industrial production. The aforementioned factors are among major driving forces accelerating the market growth for pressure sensitive adhesive tapes in the forecasted period.
Adhesive Tapes Market Segment Analysis – By End-use Industry
The packaging industry segment held a share in the adhesive tapes market in 2023 and is expected to grow at a CAGR of 5.3% during the forecast period.
The growing trend of online shopping increases the demand for packaging and distribution of goods which has led to an increase in demand for adhesive tapes worldwide. The widespread use of adhesive tapes in various industries such as automotive, healthcare, textiles, leather industry, aerospace, defence, locomotives, and others is an important factor driving the market. Adhesive tapes are in great demand in the automotive industry owing to the need for weight reduction in vehicles to boost fuel efficiency. Manufacturers are using adhesive tapes instead of bolts and screws to reduce the car weight. For an instance, according to the International Organization of Motor Vehicle Manufacturers, in 2022, the total number of automotive vehicles produced in India was valued at 5,456,857 units, representing a 24.05% increase compared to the previous year. Also, adhesive tapes are widely used in medical equipment assembly and wound care during surgery. In addition, skin-friendly adhesive tapes are widely used to make diapers for babies and adults. The growing demand for water-activated adhesive formulation adhesive tapes combined with the demand for recyclable and biodegradable packing materials has boosted the market growth.
Adhesive Tapes Market Segment Analysis – By Geography
The Asia Pacific has dominated the market in terms of revenue by 2023, owing to fast-growing end-use industries in recent years.
The Asia Pacific adhesive tapes market is the largest contributor to the adhesive tapes market. Increased growth in the various end-use industry such as healthcare, building & construction, packaging, and others. According to the Japan Packaging Institute, the shipment value of the packaging industry in Japan was approximately ¥6,079 billion (yen) or US$41 billion in 2022, reflecting a 6.9% increase. Moreover, healthcare industry has dominated in Asia pacific region owing to the great demand for medical bandages including dry clothing, and first aid kits in the region. Increasing awareness of advanced wound care is expected to further the need for new products in the region. Moreover, regional growth is largely due to the high level of economic growth followed by significant investment in various industries such as automotive, healthcare, electrical and electronics, and building & construction. Major regional players including Nitto Denko of Japan and Ajit Industries of India have inaugurated new plants and expanded their production units in their respective countries. Advantages of competitive pricing in the Asia Pacific due to lower production costs and the ability to better serve emerging local markets is among the major driving factor of the Asia Pacific adhesive tapes market.
Adhesive Tapes Market Drivers
Increased demand from Various End-use Industries
Adhesive tapes are used in end-to-end industries such as packaging, consumer & office, health care, electrical & electronics, masking, automotive, paper & printing, building & construction, retail, and more.
The trend toward the use of flat and small-electronic devices continues, increasing the use of adhesive tapes in the electrical and electronics industry. The adhesive tape demand in the healthcare and medicine industry is expected to accelerate at a very high rate during the foreseen period. This growth is due to an increase in the number of the old-age population and a growing number of patients with chronic diseases. In addition, the need for hydrophilic films, vitro diagnostics, and oral melting films are driving the demand for adhesive tapes in the global healthcare industry. According to world bank data, the total construction industry spending worldwide has increased to US4 13.4 trillion in 2022 with a growth rate of 3.8% from previous year. The construction industry is one of the major industries consuming adhesive tapes, especially in the regions such as Asia Pacific, Middle East, South America. Moreover, adhesive tapes are used for HVAC (heating ventilation, and cooling), glazing, and insulation. Thus, the demand for adhesive tapes in various industries is expected to drive market growth.
Expanding E-commerce Industry
E-commerce retail has witnessed significant growth in developing countries due to the covid-19 pandemic. This has bought demand for packaging materials that need adhesive tapes to seal the products inside cartons, to avoid mechanical damage at every stage of logistics. The need for adhesive tapes has increased due to consumer preferences from e-commerce retailers including packaging quality, the safety of products, and others. According to a survey conducted by the B2B e-commerce association of United States, in the third quarter of 2023, the share of e-commerce in total U.S. retail sales increased to 15.6%, compared to 14.8% in the third quarter of 2022.The data depicts the importance of e-commerce and penetration in total retail sales across the globe. Furthermore, retailers continue to pursue consumer demand online, streaming to e-commerce with record numbers. This means that many brands compete for customers virtually on e-commerce websites. As a result, quality packaging to cater the consumer demand is as important as the quality of the product. The aforementioned recent developments in the retail sector are expected to drive the adhesive tapes market in the forecasted period.
Adhesive Tapes Market Challenges
Volatility in Raw Material Prices
Volatility in raw material prices is among the major restraint that backfoot the adhesive tapes market.
Raw material prices and supply of raw materials are the important factors that influence the manufacturers to determine the production cost of end products. Rubber, paper, polypropylene (PP), silicone, acrylic adhesives, polyvinyl chloride (PVC), adhesives, and release liners are the major raw materials used to make adhesive tapes. According to the World Bank's Commodity Markets Outlook, in the third quarter of 2023, the raw materials price index experienced a 1 percent decline, primarily driven by decreases in natural rubber and prices of natural rubber remained relatively stable in the third quarter of 2023, but are almost 8 percent lower than a year ago. Global natural rubber demand has remained relatively flat during the 12 months ending in September 2023. Uncertainty and fluctuations in cost and unavailability of raw materials will rise the product price leading to reluctant purchases in price-sensitive regions. The adhesive industry has been affected by the increase in production costs owing to various factors. The continued increase in global demand for chemicals and energy will constrain the delivery of these basic chemicals and resin feedstock to the adhesive industry. This shortage of supply of monomers such as C9 monomers and Piperylene used to make adhesive materials has increased the cost of the overall product.
Adhesive Tapes Market Industry Outlook
Technology launches, acquisitions, and R&D activities are key strategies adopted by players in the Adhesive Tapes Market. Adhesive Tapes Market top 10 companies are:
1. Tesa SE
2. PPM Industries
3. Scapa Industrial
4. 3M
5. Adchem Corp.
6. Rochester Magnet Co.
7. CAPLUGS
8. Kruse Adhesive Tape, Inc.
9. Nitto Denko Corporation
10. Avery Dennison Corporation
Recent Developments
• In October 2023, DuPont introduced the DuPont™ Liveo™ Soft Skin Conductive Tape 1-3150, a silicone-based thermoset adhesive for biosignal monitoring. This marked a recent development in the adhesive tapes market, addressing the demand for stable data quality and high patient comfort in medical wearables.
• in May 2023, ADDEV Materials Group acquired Parafix, a move that fortified ADDEV's standing in the adhesive tapes market, especially in healthcare. This acquisition provided customers with access to medical-grade materials and enhanced capabilities for customized adhesive solutions.
• In August 2022, Lohmann introduced DuploFLEX® 5 GRIP, an adhesive tape revolutionizing the flexographic printing industry. With a unique hybrid construction, it provided exceptional grip to the sleeve, reducing solvent use by 50% and meeting sustainability demands.
Relevant Reports
Industrial Adhesives Market – Forecast (2022 – 2027)
Report Code: CMR 0683
Surgical Sealants and Adhesives Market- Forecast (2022 – 2027)
Report Code: HCR 0578
Medical Adhesive Tapes Market - Forecast (2022 – 2027)
Report Code: CMR 23197
For more Chemicals and Materials Market reports, please click here
1. Adhesive Tapes Market- Market Overview
1.1 Definitions and Scope
2. Adhesive Tapes Market - Executive Summary
2.1 Key Trends by Bond Type
2.2 Key Trends by Bonding Type
2.3 Key Trends by Thickness
2.4 Key Trends by Technology
2.5 Key Trends by Product Type
2.6 Key Trends by Resin Type
2.7 Key Trends by Substrate
2.8 Key Trends by Backing Material
2.9 Key Trends by End-use Industry
2.10 Key Trends by Geography
3. Adhesive Tapes Market – Comparative analysis
3.1 Market Share Analysis- Major Companies
3.2 Product Benchmarking- Major Companies
3.3 Top 5 Financials Analysis
3.4 Patent Analysis- Major Companies
3.5 Pricing Analysis (ASPs will be provided)
4. Adhesive Tapes Market - Startup companies Scenario Premium Premium
4.1 Major startup company analysis:
4.1.1 Investment
4.1.2 Revenue
4.1.3 Product portfolio
4.1.4 Venture Capital and Funding Scenario
5. Adhesive Tapes Market – Market Entry Scenario Premium Premium
5.1 Regulatory Framework Overview
5.2 New Business and Ease of Doing Business Index
5.3 Successful Venture Profiles
5.4 Customer Analysis – Major companies
6. Adhesive Tapes Market - Market Forces
6.1 Market Drivers
6.2 Market Constraints
6.3 Porter Five Force Model
6.3.1 Bargaining Power of Suppliers
6.3.2 Bargaining Powers of Buyers
6.3.3 The threat of New Entrants
6.3.4 Competitive Rivalry
6.3.5 Threat of Substitutes
7. Adhesive Tapes Market – Strategic Analysis
7.1 Value/Supply Chain Analysis
7.2 Opportunity Analysis
7.3 Product/Market Life Cycle
7.4 Distributor Analysis – Major Companies
8. Adhesive Tapes Market – By Bond Type (Market Size -US$ Million/Billion)
8.1 Temporary
8.2 Permanent
9. Adhesive Tapes Market – By Bonding Type (Market Size -US$ Million/Billion)
9.1 Sing Sided Tape
9.2 Double Sided Tape
10. Adhesive Tapes Market – By Thickness (Market Size -US$ Million/Billion)
10.1 Less than 20 Microns
10.2 20-30 Microns
10.3 30-40 Microns
10.4 More than 40 Microns
11. Adhesive Tapes Market – By Technology (Market Size -US$ Million/Billion)
11.1 Water Activated
11.2 Heat Activated
11.3 Pressure Sensitive Adhesives (PSA)
11.4 Others
12. Adhesive Tapes Market – By Product Type (Market Size -US$ Million/Billion)
12.1 Commodity Tapes
12.2 Speciality Tapes
12.3 Others
13. Phenolics Adhesive Tapes Market – By Resin Type (Market Size -US$ Million/Billion)
13.1 Silicones
13.2 Phenolics
13.3 Polyamides
13.4 Polyvinyl Acetate
13.5 Polyurethanes
13.6 Acrylics
13.7 Epoxies
13.8 Polysulfide
13.9 Butyl
13.10 Polyisobutylene
13.11 Rubber
13.12 Others
14. Phenolics Adhesive Tapes Market – By Backing Material (Market Size -US$ Million/Billion)
14.1 Polypropylene
14.2 Polyester
14.3 Polyvinylchloride
14.4 Cloth
14.5 Paper
14.6 Others
15. Adhesive Tapes Market – By Substrate (Market Size -US$ Million/Billion)
15.1 Ceramic
15.2 Metals
15.3 Plastic
15.4 Wood
15.5 Glass
15.6 Paper
15.7 Others
16. Adhesive Tapes Market – By End-use Industry (Market Size -US$ Million/Billion)
16.1 Building & Construction
16.1.1 Residential Construction
16.1.1.1 Independent Homes
16.1.1.2 Row Homes
16.1.1.3 Large Apartment Buildings
16.1.1.4 Others
16.1.2 Commercial Construction
16.1.2.1 Hospitals and Healthcare Infrastructure
16.1.2.2 Educational Institutes
16.1.2.3 Hotels and Restaurants
16.1.2.4 Banks and Financial Institutions
16.1.2.5 Airports
16.1.2.6 Shopping Malls
16.1.2.7 Others
16.1.3 Industrial Construction
16.1.4 Infrastructure
16.2 Automotive Industry
16.2.1 Passenger Vehicles
16.2.2 Light Commercial Vehicles
16.2.3 Heavy Commercial Vehicles
16.3 Aerospace & Defence
16.4 Marine
16.5 Locomotives
16.6 Healthcare
16.6.1 Wound Dressing
16.6.2 Surgery
16.6.3 Hygiene
16.6.4 Others
16.7 Packaging Industry
16.7.1 Food Packaging
16.7.2 Beverage Packaging
16.7.3 Personal Care & Cosmetics Packaging
16.7.4 Medical Packaging
16.7.5 Home Care Packaging
16.7.6 Other Packaging
16.8 Electrical & Electronics
16.8.1 Home Appliances Components
16.8.2 Telecommunication Components
16.8.3 Industrial Electronics Components
16.8.4 Others
16.9 Furniture & Woodworking
16.10 Power and Energy
16.10.1 Wind Energy
16.10.2 Oil & Gas
16.10.3 Solar
16.10.4 Others
16.11 Leather Industry
16.12 Hygiene and Personal Care
16.13 Others
17. Adhesive Tapes Market - By Geography (Market Size -US$ Million/Billion)
17.1 North America
17.1.1 USA
17.1.2 Canada
17.1.3 Mexico
17.2 Europe
17.2.1 UK
17.2.2 Germany
17.2.3 France
17.2.4 Italy
17.2.5 Netherlands
17.2.6 Spain
17.2.7 Russia
17.2.8 Belgium
17.2.9 Rest of Europe
17.3 Asia-Pacific
17.3.1 China
17.3.2 Japan
17.3.3 India
17.3.4 South Korea
17.3.5 Australia and New Zealand
17.3.6 Indonesia
17.3.7 Taiwan
17.3.8 Malaysia
17.3.9 Rest of APAC
17.4 South America
17.4.1 Brazil
17.4.2 Argentina
17.4.3 Colombia
17.4.4 Chile
17.4.5 Rest of South America
17.5 Rest of the World
17.5.1 Middle East
17.5.2 Africa
18. Adhesive Tapes Market – Entropy
18.1 New Product Launches
18.2 M&As, Collaborations, JVs and Partnerships
19. Adhesive Tapes Market – Industry/Competition Segment Analysis Premium
19.1 Company Benchmarking Matrix – Major Companies
19.2 Market Share at Global Level - Major companies
19.3 Market Share by Key Region - Major companies
19.4 Market Share by Key Country - Major companies
19.5 Market Share by Key Application - Major companies
19.6 Market Share by Key Product Type/Product category - Major companies
20. Adhesive Tapes Market – Key Company List by Country Premium Premium
21. Adhesive Tapes Market Company Analysis - Business Overview, Product Portfolio, Financials, and Developments
21.1 Company 1
21.2 Company 2
21.3 Company 3
21.4 Company 4
21.5 Company 5
21.6 Company 6
21.7 Company 7
21.8 Company 8
21.9 Company 9
21.10 Company 10 and more
"*Financials would be provided on a best-effort basis for private companies*"
List of Tables
Table 1: Adhesive Tapes Market Overview 2023-2030
Table 2: Adhesive Tapes Market Leader Analysis 2023-2030 (US$)
Table 3: Adhesive Tapes Market Product Analysis 2023-2030 (US$)
Table 4: Adhesive Tapes Market End User Analysis 2023-2030 (US$)
Table 5: Adhesive Tapes Market Patent Analysis 2013-2023* (US$)
Table 6: Adhesive Tapes Market Financial Analysis 2023-2030 (US$)
Table 7: Adhesive Tapes Market Driver Analysis 2023-2030 (US$)
Table 8: Adhesive Tapes Market Challenges Analysis 2023-2030 (US$)
Table 9: Adhesive Tapes Market Constraint Analysis 2023-2030 (US$)
Table 10: Adhesive Tapes Market Supplier Bargaining Power Analysis 2023-2030 (US$)
Table 11: Adhesive Tapes Market Buyer Bargaining Power Analysis 2023-2030 (US$)
Table 12: Adhesive Tapes Market Threat of Substitutes Analysis 2023-2030 (US$)
Table 13: Adhesive Tapes Market Threat of New Entrants Analysis 2023-2030 (US$)
Table 14: Adhesive Tapes Market Degree of Competition Analysis 2023-2030 (US$)
Table 15: Adhesive Tapes Market Value Chain Analysis 2023-2030 (US$)
Table 16: Adhesive Tapes Market Pricing Analysis 2023-2030 (US$)
Table 17: Adhesive Tapes Market Opportunities Analysis 2023-2030 (US$)
Table 18: Adhesive Tapes Market Product Life Cycle Analysis 2023-2030 (US$)
Table 19: Adhesive Tapes Market Supplier Analysis 2023-2030 (US$)
Table 20: Adhesive Tapes Market Distributor Analysis 2023-2030 (US$)
Table 21: Adhesive Tapes Market Trend Analysis 2023-2030 (US$)
Table 22: Adhesive Tapes Market Size 2023 (US$)
Table 23: Adhesive Tapes Market Forecast Analysis 2023-2030 (US$)
Table 24: Adhesive Tapes Market Sales Forecast Analysis 2023-2030 (Units)
Table 25: Adhesive Tapes Market, Revenue & Volume, By Material Type, 2023-2030 ($)
Table 26: Adhesive Tapes Market By Material Type, Revenue & Volume,By Polyvinyl Chloride, 2023-2030 ($)
Table 27: Adhesive Tapes Market By Material Type, Revenue & Volume,By Polypropylene, 2023-2030 ($)
Table 28: Adhesive Tapes Market By Material Type, Revenue & Volume,By Paper, 2023-2030 ($)
Table 29: Adhesive Tapes Market, Revenue & Volume,By Product, 2023-2030 ($)
Table 30: Adhesive Tapes Market By Product, Revenue & Volume,By Commodity Tapes, 2023-2030 ($)
Table 31: Adhesive Tapes Market By Product, Revenue & Volume,By Specialty Tapes, 2023-2030 ($)
Table 32: Adhesive Tapes Market, Revenue & Volume,By Technology, 2023-2030 ($)
Table 33: Adhesive Tapes Market By Technology, Revenue & Volume,By Solvent-based, 2023-2030 ($)
Table 34: Adhesive Tapes Market By Technology, Revenue & Volume,By Water-based, 2023-2030 ($)
Table 35: Adhesive Tapes Market By Technology, Revenue & Volume,By Hot-melt, 2023-2030 ($)
Table 36: Adhesive Tapes Market, Revenue & Volume,By Application, 2023-2030 ($)
Table 37: Adhesive Tapes Market By Application, Revenue & Volume,By Packaging, 2023-2030 ($)
Table 38: Adhesive Tapes Market By Application, Revenue & Volume,By Consumer Products, 2023-2030 ($)
Table 39: Adhesive Tapes Market By Application, Revenue & Volume,By Healthcare, 2023-2030 ($)
Table 40: Adhesive Tapes Market By Application, Revenue & Volume,By Electrical and Electronics, 2023-2030 ($)
Table 41: Adhesive Tapes Market By Application, Revenue & Volume,By Automotive, 2023-2030 ($)
Table 42: North America Adhesive Tapes Market, Revenue & Volume, By Material Type, 2023-2030 ($)
Table 43: North America Adhesive Tapes Market, Revenue & Volume,By Product, 2023-2030 ($)
Table 44: North America Adhesive Tapes Market, Revenue & Volume,By Technology, 2023-2030 ($)
Table 45: North America Adhesive Tapes Market, Revenue & Volume,By Application, 2023-2030 ($)
Table 46: South america Adhesive Tapes Market, Revenue & Volume, By Material Type, 2023-2030 ($)
Table 47: South america Adhesive Tapes Market, Revenue & Volume,By Product, 2023-2030 ($)
Table 48: South america Adhesive Tapes Market, Revenue & Volume,By Technology, 2023-2030 ($)
Table 49: South america Adhesive Tapes Market, Revenue & Volume,By Application, 2023-2030 ($)
Table 50: Europe Adhesive Tapes Market, Revenue & Volume, By Material Type, 2023-2030 ($)
Table 51: Europe Adhesive Tapes Market, Revenue & Volume, By Product, 2023-2030 ($)
Table 52: Europe Adhesive Tapes Market, Revenue & Volume, By Technology, 2023-2030 ($)
Table 53: Europe Adhesive Tapes Market, Revenue & Volume, By Application, 2023-2030 ($)
Table 54: APAC Adhesive Tapes Market, Revenue & Volume, By Material Type, 2023-2030 ($)
Table 55: APAC Adhesive Tapes Market, Revenue & Volume, By Product, 2023-2030 ($)
Table 56: APAC Adhesive Tapes Market, Revenue & Volume, By Technology, 2023-2030 ($)
Table 57: APAC Adhesive Tapes Market, Revenue & Volume, By Application, 2023-2030 ($)
Table 58: Middle East & Africa Adhesive Tapes Market, Revenue & Volume, By Material Type, 2023-2030 ($)
Table 59: Middle East & Africa Adhesive Tapes Market, Revenue & Volume,By Product, 2023-2030 ($)
Table 60: Middle East & Africa Adhesive Tapes Market, Revenue & Volume,By Technology, 2023-2030 ($)
Table 61: Middle East & Africa Adhesive Tapes Market, Revenue & Volume,By Application, 2023-2030 ($)
Table 62: Russia Adhesive Tapes Market, Revenue & Volume, By Material Type, 2023-2030 ($)
Table 63: Russia Adhesive Tapes Market, Revenue & Volume, By Product, 2023-2030 ($)
Table 64: Russia Adhesive Tapes Market, Revenue & Volume, By Technology, 2023-2030 ($)
Table 65: Russia Adhesive Tapes Market, Revenue & Volume, By Application, 2023-2030 ($)
Table 66: Israel Adhesive Tapes Market, Revenue & Volume, By Material Type, 2023-2030 ($)
Table 67: Israel Adhesive Tapes Market, Revenue & Volume, By Product, 2023-2030 ($)
Table 68: Israel Adhesive Tapes Market, Revenue & Volume, By Technology, 2023-2030 ($)
Table 69: Israel Adhesive Tapes Market, Revenue & Volume, By Application, 2023-2030 ($)
Table 70: Top Companies 2023 (US$) Adhesive Tapes Market, Revenue & Volume
Table 71: Product Launch 2023-2030 Adhesive Tapes Market, Revenue & Volume
Table 72: Mergers & Acquistions 2023-2030 Adhesive Tapes Market, Revenue & Volume
List of Figures
Figure 1: Overview of Adhesive Tapes Market 2023-2030
Figure 2: Market Share Analysis for Adhesive Tapes Market 2023 (US$)
Figure 3: Product Comparison in Adhesive Tapes Market 2023-2030 (US$)
Figure 4: End User Profile for Adhesive Tapes Market 2023-2030 (US$)
Figure 5: Patent Application and Grant in Adhesive Tapes Market 2013-2023* (US$)
Figure 6: Top 5 Companies Financial Analysis in Adhesive Tapes Market 2023-2030 (US$)
Figure 7: Market Entry Strategy in Adhesive Tapes Market 2023-2030
Figure 8: Ecosystem Analysis in Adhesive Tapes Market 2023
Figure 9: Average Selling Price in Adhesive Tapes Market 2023-2030
Figure 10: Top Opportunites in Adhesive Tapes Market 2023-2030
Figure 11: Market Life Cycle Analysis in Adhesive Tapes Market
Figure 12: Global By Material TypeAdhesive Tapes Market Revenue, 2023-2030 ($)
Figure 13: GlobalBy Product Adhesive Tapes Market Revenue, 2023-2030 ($)
Figure 14: GlobalBy TechnologyAdhesive Tapes Market Revenue, 2023-2030 ($)
Figure 15: GlobalBy ApplicationAdhesive Tapes Market Revenue, 2023-2030 ($)
Figure 16: Global Adhesive Tapes Market - By Geography
Figure 17: Global Adhesive Tapes Market Value & Volume, By Geography, 2023-2030 ($)
Figure 18: Global Adhesive Tapes Market CAGR, By Geography, 2023-2030 (%)
Figure 19: North America Adhesive Tapes Market Value & Volume, 2023-2030 ($)
Figure 20: US Adhesive Tapes Market Value & Volume, 2023-2030 ($)
Figure 21: US GDP and Population, 2023-2030 ($)
Figure 22: US GDP – Composition of 2023, By Sector of Origin
Figure 23: US Export and Import Value & Volume, 2023-2030 ($)
Figure 24: Canada Adhesive Tapes Market Value & Volume, 2023-2030 ($)
Figure 25: Canada GDP and Population, 2023-2030 ($)
Figure 26: Canada GDP – Composition of 2023, By Sector of Origin
Figure 27: Canada Export and Import Value & Volume, 2023-2030 ($)
Figure 28: Mexico Adhesive Tapes Market Value & Volume, 2023-2030 ($)
Figure 29: Mexico GDP and Population, 2023-2030 ($)
Figure 30: Mexico GDP – Composition of 2023, By Sector of Origin
Figure 31: Mexico Export and Import Value & Volume, 2023-2030 ($)
Figure 32: South America Adhesive Tapes Market Value & Volume, 2023-2030 ($)
Figure 33: Brazil Adhesive Tapes Market Value & Volume, 2023-2030 ($)
Figure 34: Brazil GDP and Population, 2023-2030 ($)
Figure 35: Brazil GDP – Composition of 2023, By Sector of Origin
Figure 36: Brazil Export and Import Value & Volume, 2023-2030 ($)
Figure 37: Venezuela Adhesive Tapes Market Value & Volume, 2023-2030 ($)
Figure 38: Venezuela GDP and Population, 2023-2030 ($)
Figure 39: Venezuela GDP – Composition of 2023, By Sector of Origin
Figure 40: Venezuela Export and Import Value & Volume, 2023-2030 ($)
Figure 41: Argentina Adhesive Tapes Market Value & Volume, 2023-2030 ($)
Figure 42: Argentina GDP and Population, 2023-2030 ($)
Figure 43: Argentina GDP – Composition of 2023, By Sector of Origin
Figure 44: Argentina Export and Import Value & Volume, 2023-2030 ($)
Figure 45: Ecuador Adhesive Tapes Market Value & Volume, 2023-2030 ($)
Figure 46: Ecuador GDP and Population, 2023-2030 ($)
Figure 47: Ecuador GDP – Composition of 2023, By Sector of Origin
Figure 48: Ecuador Export and Import Value & Volume, 2023-2030 ($)
Figure 49: Peru Adhesive Tapes Market Value & Volume, 2023-2030 ($)
Figure 50: Peru GDP and Population, 2023-2030 ($)
Figure 51: Peru GDP – Composition of 2023, By Sector of Origin
Figure 52: Peru Export and Import Value & Volume, 2023-2030 ($)
Figure 53: Colombia Adhesive Tapes Market Value & Volume, 2023-2030 ($)
Figure 54: Colombia GDP and Population, 2023-2030 ($)
Figure 55: Colombia GDP – Composition of 2023, By Sector of Origin
Figure 56: Colombia Export and Import Value & Volume, 2023-2030 ($)
Figure 57: Costa Rica Adhesive Tapes Market Value & Volume, 2023-2030 ($)
Figure 58: Costa Rica GDP and Population, 2023-2030 ($)
Figure 59: Costa Rica GDP – Composition of 2023, By Sector of Origin
Figure 60: Costa Rica Export and Import Value & Volume, 2023-2030 ($)
Figure 61: Europe Adhesive Tapes Market Value & Volume, 2023-2030 ($)
Figure 62: U.K Adhesive Tapes Market Value & Volume, 2023-2030 ($)
Figure 63: U.K GDP and Population, 2023-2030 ($)
Figure 64: U.K GDP – Composition of 2023, By Sector of Origin
Figure 65: U.K Export and Import Value & Volume, 2023-2030 ($)
Figure 66: Germany Adhesive Tapes Market Value & Volume, 2023-2030 ($)
Figure 67: Germany GDP and Population, 2023-2030 ($)
Figure 68: Germany GDP – Composition of 2023, By Sector of Origin
Figure 69: Germany Export and Import Value & Volume, 2023-2030 ($)
Figure 70: Italy Adhesive Tapes Market Value & Volume, 2023-2030 ($)
Figure 71: Italy GDP and Population, 2023-2030 ($)
Figure 72: Italy GDP – Composition of 2023, By Sector of Origin
Figure 73: Italy Export and Import Value & Volume, 2023-2030 ($)
Figure 74: France Adhesive Tapes Market Value & Volume, 2023-2030 ($)
Figure 75: France GDP and Population, 2023-2030 ($)
Figure 76: France GDP – Composition of 2023, By Sector of Origin
Figure 77: France Export and Import Value & Volume, 2023-2030 ($)
Figure 78: Netherlands Adhesive Tapes Market Value & Volume, 2023-2030 ($)
Figure 79: Netherlands GDP and Population, 2023-2030 ($)
Figure 80: Netherlands GDP – Composition of 2023, By Sector of Origin
Figure 81: Netherlands Export and Import Value & Volume, 2023-2030 ($)
Figure 82: Belgium Adhesive Tapes Market Value & Volume, 2023-2030 ($)
Figure 83: Belgium GDP and Population, 2023-2030 ($)
Figure 84: Belgium GDP – Composition of 2023, By Sector of Origin
Figure 85: Belgium Export and Import Value & Volume, 2023-2030 ($)
Figure 86: Spain Adhesive Tapes Market Value & Volume, 2023-2030 ($)
Figure 87: Spain GDP and Population, 2023-2030 ($)
Figure 88: Spain GDP – Composition of 2023, By Sector of Origin
Figure 89: Spain Export and Import Value & Volume, 2023-2030 ($)
Figure 90: Denmark Adhesive Tapes Market Value & Volume, 2023-2030 ($)
Figure 91: Denmark GDP and Population, 2023-2030 ($)
Figure 92: Denmark GDP – Composition of 2023, By Sector of Origin
Figure 93: Denmark Export and Import Value & Volume, 2023-2030 ($)
Figure 94: APAC Adhesive Tapes Market Value & Volume, 2023-2030 ($)
Figure 95: China Adhesive Tapes Market Value & Volume, 2023-2030
Figure 96: China GDP and Population, 2023-2030 ($)
Figure 97: China GDP – Composition of 2023, By Sector of Origin
Figure 98: China Export and Import Value & Volume, 2023-2030 ($)Adhesive Tapes Market China Export and Import Value & Volume, 2023-2030 ($)
Figure 99: Australia Adhesive Tapes Market Value & Volume, 2023-2030 ($)
Figure 100: Australia GDP and Population, 2023-2030 ($)
Figure 101: Australia GDP – Composition of 2023, By Sector of Origin
Figure 102: Australia Export and Import Value & Volume, 2023-2030 ($)
Figure 103: South Korea Adhesive Tapes Market Value & Volume, 2023-2030 ($)
Figure 104: South Korea GDP and Population, 2023-2030 ($)
Figure 105: South Korea GDP – Composition of 2023, By Sector of Origin
Figure 106: South Korea Export and Import Value & Volume, 2023-2030 ($)
Figure 107: India Adhesive Tapes Market Value & Volume, 2023-2030 ($)
Figure 108: India GDP and Population, 2023-2030 ($)
Figure 109: India GDP – Composition of 2023, By Sector of Origin
Figure 110: India Export and Import Value & Volume, 2023-2030 ($)
Figure 111: Taiwan Adhesive Tapes Market Value & Volume, 2023-2030 ($)
Figure 112: Taiwan GDP and Population, 2023-2030 ($)
Figure 113: Taiwan GDP – Composition of 2023, By Sector of Origin
Figure 114: Taiwan Export and Import Value & Volume, 2023-2030 ($)
Figure 115: Malaysia Adhesive Tapes Market Value & Volume, 2023-2030 ($)
Figure 116: Malaysia GDP and Population, 2023-2030 ($)
Figure 117: Malaysia GDP – Composition of 2023, By Sector of Origin
Figure 118: Malaysia Export and Import Value & Volume, 2023-2030 ($)
Figure 119: Hong Kong Adhesive Tapes Market Value & Volume, 2023-2030 ($)
Figure 120: Hong Kong GDP and Population, 2023-2030 ($)
Figure 121: Hong Kong GDP – Composition of 2023, By Sector of Origin
Figure 122: Hong Kong Export and Import Value & Volume, 2023-2030 ($)
Figure 123: Middle East & Africa Adhesive Tapes Market Middle East & Africa 3D Printing Market Value & Volume, 2023-2030 ($)
Figure 124: Russia Adhesive Tapes Market Value & Volume, 2023-2030 ($)
Figure 125: Russia GDP and Population, 2023-2030 ($)
Figure 126: Russia GDP – Composition of 2023, By Sector of Origin
Figure 127: Russia Export and Import Value & Volume, 2023-2030 ($)
Figure 128: Israel Adhesive Tapes Market Value & Volume, 2023-2030 ($)
Figure 129: Israel GDP and Population, 2023-2030 ($)
Figure 130: Israel GDP – Composition of 2023, By Sector of Origin
Figure 131: Israel Export and Import Value & Volume, 2023-2030 ($)
Figure 132: Entropy Share, By Strategies, 2023-2030* (%)Adhesive Tapes Market
Figure 133: Developments, 2023-2030*Adhesive Tapes Market
Figure 134: Company 1 Adhesive Tapes Market Net Revenue, By Years, 2023-2030* ($)
Figure 135: Company 1 Adhesive Tapes Market Net Revenue Share, By Business segments, 2023 (%)
Figure 136: Company 1 Adhesive Tapes Market Net Sales Share, By Geography, 2023 (%)
Figure 137: Company 2 Adhesive Tapes Market Net Revenue, By Years, 2023-2030* ($)
Figure 138: Company 2 Adhesive Tapes Market Net Revenue Share, By Business segments, 2023 (%)
Figure 139: Company 2 Adhesive Tapes Market Net Sales Share, By Geography, 2023 (%)
Figure 140: Company 3Adhesive Tapes Market Net Revenue, By Years, 2023-2030* ($)
Figure 141: Company 3Adhesive Tapes Market Net Revenue Share, By Business segments, 2023 (%)
Figure 142: Company 3Adhesive Tapes Market Net Sales Share, By Geography, 2023 (%)
Figure 143: Company 4 Adhesive Tapes Market Net Revenue, By Years, 2023-2030* ($)
Figure 144: Company 4 Adhesive Tapes Market Net Revenue Share, By Business segments, 2023 (%)
Figure 145: Company 4 Adhesive Tapes Market Net Sales Share, By Geography, 2023 (%)
Figure 146: Company 5 Adhesive Tapes Market Net Revenue, By Years, 2023-2030* ($)
Figure 147: Company 5 Adhesive Tapes Market Net Revenue Share, By Business segments, 2023 (%)
Figure 148: Company 5 Adhesive Tapes Market Net Sales Share, By Geography, 2023 (%)
Figure 149: Company 6 Adhesive Tapes Market Net Revenue, By Years, 2023-2030* ($)
Figure 150: Company 6 Adhesive Tapes Market Net Revenue Share, By Business segments, 2023 (%)
Figure 151: Company 6 Adhesive Tapes Market Net Sales Share, By Geography, 2023 (%)
Figure 152: Company 7 Adhesive Tapes Market Net Revenue, By Years, 2023-2030* ($)
Figure 153: Company 7 Adhesive Tapes Market Net Revenue Share, By Business segments, 2023 (%)
Figure 154: Company 7 Adhesive Tapes Market Net Sales Share, By Geography, 2023 (%)
Figure 155: Company 8 Adhesive Tapes Market Net Revenue, By Years, 2023-2030* ($)
Figure 156: Company 8 Adhesive Tapes Market Net Revenue Share, By Business segments, 2023 (%)
Figure 157: Company 8 Adhesive Tapes Market Net Sales Share, By Geography, 2023 (%)
Figure 158: Company 9 Adhesive Tapes Market Net Revenue, By Years, 2023-2030* ($)
Figure 159: Company 9 Adhesive Tapes Market Net Revenue Share, By Business segments, 2023 (%)
Figure 160: Company 9 Adhesive Tapes Market Net Sales Share, By Geography, 2023 (%)
Figure 161: Company 10 Adhesive Tapes Market Net Revenue, By Years, 2023-2030* ($)
Figure 162: Company 10 Adhesive Tapes Market Net Revenue Share, By Business segments, 2023 (%)
Figure 163: Company 10 Adhesive Tapes Market Net Sales Share, By Geography, 2023 (%)
Figure 164: Company 11 Adhesive Tapes Market Net Revenue, By Years, 2023-2030* ($)
Figure 165: Company 11 Adhesive Tapes Market Net Revenue Share, By Business segments, 2023 (%)
Figure 166: Company 11 Adhesive Tapes Market Net Sales Share, By Geography, 2023 (%)
Figure 167: Company 12 Adhesive Tapes Market Net Revenue, By Years, 2023-2030* ($)
Figure 168: Company 12 Adhesive Tapes Market Net Revenue Share, By Business segments, 2023 (%)
Figure 169: Company 12 Adhesive Tapes Market Net Sales Share, By Geography, 2023 (%)
Figure 170: Company 13Adhesive Tapes Market Net Revenue, By Years, 2023-2030* ($)
Figure 171: Company 13Adhesive Tapes Market Net Revenue Share, By Business segments, 2023 (%)
Figure 172: Company 13Adhesive Tapes Market Net Sales Share, By Geography, 2023 (%)
Figure 173: Company 14 Adhesive Tapes Market Net Revenue, By Years, 2023-2030* ($)
Figure 174: Company 14 Adhesive Tapes Market Net Revenue Share, By Business segments, 2023 (%)
Figure 175: Company 14 Adhesive Tapes Market Net Sales Share, By Geography, 2023 (%)
Figure 176: Company 15 Adhesive Tapes Market Net Revenue, By Years, 2023-2030* ($)
Figure 177: Company 15 Adhesive Tapes Market Net Revenue Share, By Business segments, 2023 (%)
Figure 178: Company 15 Adhesive Tapes Market Net Sales Share, By Geography, 2023 (%)