 Email
Email Print
Print


Tachometer Market Overview:
Tachometer Market size is estimated to reach US$3 billion by 2030, growing at a CAGR of 5.5% during the forecast period 2024-2030. Increasing number of vehicles sold and Growth in various applications are expected to propel the growth of Tachometer Market.
The increasing integration of digital technology, digital tachometers offer several advantages over traditional analog counterparts, including higher accuracy, better readability, and compatibility with modern control systems. The adoption of digital tachometers is driven by the demand for more precise speed monitoring in various industries such as automotive, manufacturing, and aerospace. Additionally, digital tachometers often feature advanced functionalities like data logging, wireless connectivity, and remote monitoring, catering to the evolving needs of businesses for real-time performance analysis and decision-making. The shift towards smart and connected solutions, with the rise of Industry 4.0 and the Internet of Things (IoT), there is a growing emphasis on integrating tachometers into connected ecosystems. Smart tachometers equipped with IoT capabilities enable seamless communication with other devices and systems, facilitating predictive maintenance, condition monitoring, and overall equipment optimization. These connected solutions empower businesses to enhance operational efficiency, minimize downtime, and optimize resource utilization.
Market Snapshot:

Tachometer Market - Report Coverage:
The “Tachometer Market Report - Forecast (2024-2030)” by IndustryARC, covers an in-depth analysis of the following segments in the Tachometer Market.
| Attribute | Segment |
|---|---|
|
By Type |
|
|
By Data Acquisition Technique |
|
|
By Measurement Type |
|
|
By Application |
|
|
By Geography |
|
COVID-19 / Ukraine Crisis - Impact Analysis:
- The COVID-19 pandemic significantly affected the tachometer market by causing disruptions in global supply chains and commodity markets. With lockdowns and restrictions imposed worldwide, manufacturing processes faced delays, impacting the production and distribution of tachometers. Additionally, reduced industrial activities during the pandemic led to a decline in demand for tachometers across various sectors, further impacting market growth.
- The war in Ukraine has exerted immense pressure on the tachometer market and its related industries. The conflict has contributed to increased volatility in commodity markets, particularly affecting the supply of raw materials necessary for manufacturing tachometers. Moreover, disruptions in transportation routes due to the conflict have hampered logistics and distribution networks, hindering the timely delivery of tachometer components and finished products to end-users.
Key Takeaways:
Digital Tachometer Dominated the Market
According to the Tachometer Market analysis, in the Tachometer market share, Digital Tachometer is analyzed to hold a dominant market share of 54% in 2023. Advancements in digital technology have led to the development of highly accurate and reliable digital tachometer solutions. Digital tachometers offer superior performance compared to traditional analog counterparts, with features such as precise measurement, enhanced readability, and greater flexibility in data processing and analysis. The growing demand for automation and digitalization across industries has fueled the adoption of digital tachometers. These tachometers are integral components of modern automated systems, providing real-time speed monitoring and control capabilities essential for optimizing operational efficiency and productivity. Additionally, the versatility of digital tachometers allows them to cater to a wide range of applications beyond automotive, including manufacturing, aerospace, marine, and renewable energy sectors. Factors such as the increasing emphasis on predictive maintenance, the integration of tachometers with IoT platforms, and the demand for smart monitoring solutions have further propelled the growth of digital tachometers. With their ability to provide actionable insights, remote monitoring capabilities, and compatibility with advanced control systems, digital tachometers are poised to maintain their dominance in the tachometer market for the foreseeable future, driving innovation and shaping the trajectory of industrial automation.
Automobiles is the fastest growing segment
In the Tachometer Market forecast, Automobiles segment is estimated to grow with a CAGR of 7.3% during the forecast period. The automotive sector is witnessing significant technological advancements and innovations, particularly in the realm of vehicle electrification and connectivity. As vehicles become increasingly electrified with the proliferation of electric and hybrid vehicles, the need for accurate speed monitoring and control becomes paramount. Tachometers play a crucial role in electric drivetrains, where they measure motor speed and provide essential feedback for controlling acceleration, deceleration, and regenerative braking systems. The integration of advanced driver assistance systems (ADAS) and autonomous driving technologies is fueling demand for sophisticated instrumentation and sensors, including tachometers. These technologies rely on precise speed measurement for functions such as adaptive cruise control, lane-keeping assistance, and collision avoidance systems. As automakers strive to enhance vehicle safety, comfort, and performance, tachometers are becoming indispensable components of modern automotive systems. The increasing emphasis on vehicle performance and efficiency is driving the adoption of tachometers in performance-oriented vehicles, sports cars, and racing applications. Tachometers provide drivers with real-time feedback on engine speed, enabling them to optimize gear shifts, monitor engine performance, and prevent over-revving, thereby enhancing vehicle performance and fuel efficiency. As the automotive industry continues to evolve, tachometers will remain integral components, driving innovation and shaping the future of automotive instrumentation.
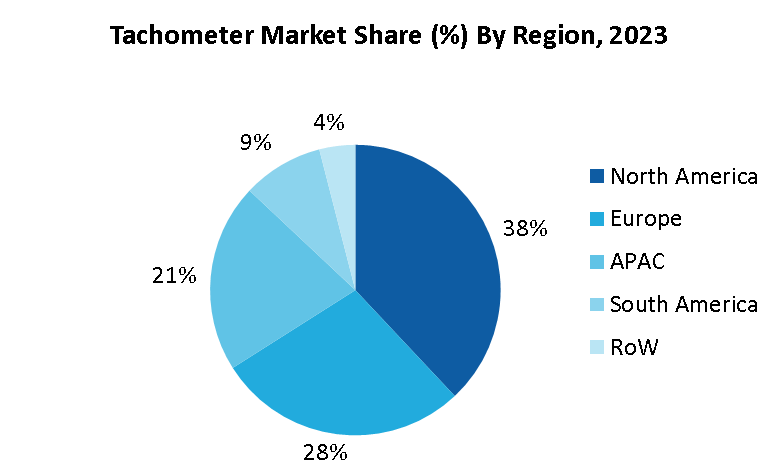
North America to Hold Largest Market Share
According to the Tachometer Market analysis, North America region is estimated to hold the largest market share of 38% in 2023. North America boasts a robust industrial landscape characterized by advanced manufacturing, automotive production, aerospace engineering, and other high-tech industries. These sectors heavily rely on tachometers for monitoring the speed of machinery, engines, and various rotating components to ensure efficient operations and product quality. The region's strong emphasis on technological innovation and automation further drives the demand for precise speed measurement solutions, fueling the adoption of tachometers across diverse applications. Additionally, North America is home to a large number of key players and manufacturers operating in the tachometer market. These companies leverage the region's technological expertise, research and development capabilities, and access to skilled labor to develop cutting-edge tachometer solutions tailored to the specific needs of different industries. Furthermore, the region's stringent regulatory environment and focus on quality standards contribute to the production of high-quality and reliable tachometer products, enhancing customer trust and market penetration. As a result, North America remains at the forefront of technological innovation and market leadership in the tachometer industry, poised to maintain its position as the largest market share holder in the foreseeable future.
Increasing Number of Vehicles Sold
The increasing number of vehicles sold in the tachometer market due to its direct correlation with the automotive industry's growth. As vehicle sales surge globally, there is a proportional rise in the demand for automotive components and technologies, including tachometers. Tachometers play a crucial role in vehicles by measuring engine speed or RPM (revolutions per minute), providing essential feedback to drivers about engine performance. With the automotive industry witnessing steady expansion, fueled by factors like urbanization, rising disposable incomes, and technological advancements, the demand for tachometers is expected to escalate. Moreover, the incorporation of tachometers is not limited to traditional gasoline-powered vehicles but also extends to electric and hybrid vehicles, further amplifying the market potential. As automotive manufacturers strive to meet stringent regulatory requirements, enhance vehicle performance, and improve fuel efficiency, the adoption of tachometers becomes imperative, driving innovation and growth within the tachometer market. Thus, the increasing number of vehicles sold acts as a pivotal driver, shaping the trajectory of the tachometer market.
Growth in Various Applications
The expanding industrial automation sector has led to increased demand for tachometers across diverse industries such as manufacturing, aerospace, and robotics. In manufacturing, tachometers are essential for monitoring the speed of machinery and ensuring optimal performance in production processes. Similarly, in the aerospace industry, tachometers play a crucial role in monitoring engine speed and rotational speed of aircraft components, contributing to safety and efficiency. The rise of renewable energy sources such as wind and solar power has created new opportunities for tachometer usage. Tachometers are integral components in wind turbines and solar tracking systems, where they monitor rotor speed and solar panel orientation, respectively, optimizing energy generation. Additionally, the growing popularity of electric vehicles (EVs) has spurred demand for tachometers in electric drivetrains, where they monitor motor speed and assist in controlling acceleration and braking. Overall, the expansion of applications beyond automotive underscores the versatility and adaptability of tachometers in diverse sectors, driving market growth and innovation.
Maintaining Accuracy and Reliability Challenges the Market Growth
Ensuring precision in speed measurement across various operating conditions and environments. Tachometers must deliver accurate readings even in harsh industrial settings characterized by vibrations, temperature fluctuations, and electromagnetic interference. Achieving this level of accuracy requires robust design and calibration processes, as well as the use of high-quality components resistant to environmental factors. Another constraint is the need for consistent reliability over extended periods of operation. Tachometers are often deployed in critical systems where any malfunction or downtime can lead to significant consequences, such as in manufacturing equipment, power generation plants, or aerospace applications. Therefore, reliability is paramount to ensure uninterrupted performance and prevent costly downtime. However, factors such as component wear, calibration drift, and electronic failures can compromise the reliability of tachometers over time, necessitating regular maintenance and recalibration to mitigate risks. The complexity of modern industrial systems and the integration of tachometers with advanced control and monitoring systems present additional challenges.
For More Details on This Report - Request for Sample
Key Market Players:
Product/Service launches, approvals, patents and events, acquisitions, partnerships and collaborations are key strategies adopted by players in the Tachometer Market. The top 10 companies in this industry are listed below:
- Dynapar (The Fortive Corporation)
- JTEKT Electronics Corporation
- OMRON Corporation
- AMETEK Instrumentation Systems
- Rockwell Automation
- Bourns, Inc.
- Nidec Drive Technology Corporation
- TE Connectivity Ltd.
- Lutron Instruments
- Pepperl+Fuchs
Scope of Report:
| Report Metric | Details |
|---|---|
|
Base Year Considered |
2023 |
|
Forecast Period |
2024–2030 |
|
CAGR |
5.5% |
|
Market Size in 2030 |
$3 billion |
|
Segments Covered |
Type, Data Acquisition Technique, Measurement Type, Application |
|
Geographies Covered |
North America (U.S., Canada and Mexico), Europe (Germany, France, UK, Italy, Spain, Netherlands and Rest of Europe), Asia-Pacific (China, Japan, South Korea, India, Australia & New Zealand and Rest of Asia-Pacific), South America (Brazil, Argentina, Colombia and Rest of South America), Rest of the World (Middle East and Africa). |
|
Key Market Players |
|
For more Automation and Instrumentation Market reports, please click here
List of Tables
Table 1 : Tachometer Market Overview 2023-2030
Table 2 : Tachometer Market Leader Analysis 2023-2030 (US$)
Table 3 : Tachometer Market Product Analysis 2023-2030 (US$)
Table 4 : Tachometer Market End User Analysis 2023-2030 (US$)
Table 5 : Tachometer Market Patent Analysis 2013-2023* (US$)
Table 6 : Tachometer Market Financial Analysis 2023-2030 (US$)
Table 7 : Tachometer Market Driver Analysis 2023-2030 (US$)
Table 8 : Tachometer Market Challenges Analysis 2023-2030 (US$)
Table 9 : Tachometer Market Constraint Analysis 2023-2030 (US$)
Table 10 : Tachometer Market Supplier Bargaining Power Analysis 2023-2030 (US$)
Table 11 : Tachometer Market Buyer Bargaining Power Analysis 2023-2030 (US$)
Table 12 : Tachometer Market Threat of Substitutes Analysis 2023-2030 (US$)
Table 13 : Tachometer Market Threat of New Entrants Analysis 2023-2030 (US$)
Table 14 : Tachometer Market Degree of Competition Analysis 2023-2030 (US$)
Table 15 : Tachometer Market Value Chain Analysis 2023-2030 (US$)
Table 16 : Tachometer Market Pricing Analysis 2023-2030 (US$)
Table 17 : Tachometer Market Opportunities Analysis 2023-2030 (US$)
Table 18 : Tachometer Market Product Life Cycle Analysis 2023-2030 (US$)
Table 19 : Tachometer Market Supplier Analysis 2023-2030 (US$)
Table 20 : Tachometer Market Distributor Analysis 2023-2030 (US$)
Table 21 : Tachometer Market Trend Analysis 2023-2030 (US$)
Table 22 : Tachometer Market Size 2023 (US$)
Table 23 : Tachometer Market Forecast Analysis 2023-2030 (US$)
Table 24 : Tachometer Market Sales Forecast Analysis 2023-2030 (Units)
Table 25 : Tachometer Market, Revenue & Volume, By Type, 2023-2030 ($)
Table 26 : Tachometer Market By Type, Revenue & Volume, By Digital, 2023-2030 ($)
Table 27 : Tachometer Market By Type, Revenue & Volume, By Analog, 2023-2030 ($)
Table 28 : Tachometer Market, Revenue & Volume, By Data Acquisition Technique, 2023-2030 ($)
Table 29 : Tachometer Market By Data Acquisition Technique, Revenue & Volume, By Contact Type, 2023-2030 ($)
Table 30 : Tachometer Market By Data Acquisition Technique, Revenue & Volume, By Non Contact Type, 2023-2030 ($)
Table 31 : Tachometer Market, Revenue & Volume, By Measurement Technique, 2023-2030 ($)
Table 32 : Tachometer Market By Measurement Technique, Revenue & Volume, By Time Measurement, 2023-2030 ($)
Table 33 : Tachometer Market By Measurement Technique, Revenue & Volume, By Frequency Measurement, 2023-2030 ($)
Table 34 : Tachometer Market, Revenue & Volume, By Application, 2023-2030 ($)
Table 35 : Tachometer Market By Application, Revenue & Volume, By Automobiles, 2023-2030 ($)
Table 36 : Tachometer Market By Application, Revenue & Volume, By Aircrafts, 2023-2030 ($)
Table 37 : Tachometer Market By Application, Revenue & Volume, By Medical, 2023-2030 ($)
Table 38 : Tachometer Market By Application, Revenue & Volume, By Others, 2023-2030 ($)
Table 39 : North America Tachometer Market, Revenue & Volume, By Type, 2023-2030 ($)
Table 40 : North America Tachometer Market, Revenue & Volume, By Data Acquisition Technique, 2023-2030 ($)
Table 41 : North America Tachometer Market, Revenue & Volume, By Measurement Technique, 2023-2030 ($)
Table 42 : North America Tachometer Market, Revenue & Volume, By Application, 2023-2030 ($)
Table 43 : South america Tachometer Market, Revenue & Volume, By Type, 2023-2030 ($)
Table 44 : South america Tachometer Market, Revenue & Volume, By Data Acquisition Technique, 2023-2030 ($)
Table 45 : South america Tachometer Market, Revenue & Volume, By Measurement Technique, 2023-2030 ($)
Table 46 : South america Tachometer Market, Revenue & Volume, By Application, 2023-2030 ($)
Table 47 : Europe Tachometer Market, Revenue & Volume, By Type, 2023-2030 ($)
Table 48 : Europe Tachometer Market, Revenue & Volume, By Data Acquisition Technique, 2023-2030 ($)
Table 49 : Europe Tachometer Market, Revenue & Volume, By Measurement Technique, 2023-2030 ($)
Table 50 : Europe Tachometer Market, Revenue & Volume, By Application, 2023-2030 ($)
Table 51 : APAC Tachometer Market, Revenue & Volume, By Type, 2023-2030 ($)
Table 52 : APAC Tachometer Market, Revenue & Volume, By Data Acquisition Technique, 2023-2030 ($)
Table 53 : APAC Tachometer Market, Revenue & Volume, By Measurement Technique, 2023-2030 ($)
Table 54 : APAC Tachometer Market, Revenue & Volume, By Application, 2023-2030 ($)
Table 55 : Middle East & Africa Tachometer Market, Revenue & Volume, By Type, 2023-2030 ($)
Table 56 : Middle East & Africa Tachometer Market, Revenue & Volume, By Data Acquisition Technique, 2023-2030 ($)
Table 57 : Middle East & Africa Tachometer Market, Revenue & Volume, By Measurement Technique, 2023-2030 ($)
Table 58 : Middle East & Africa Tachometer Market, Revenue & Volume, By Application, 2023-2030 ($)
Table 59 : Russia Tachometer Market, Revenue & Volume, By Type, 2023-2030 ($)
Table 60 : Russia Tachometer Market, Revenue & Volume, By Data Acquisition Technique, 2023-2030 ($)
Table 61 : Russia Tachometer Market, Revenue & Volume, By Measurement Technique, 2023-2030 ($)
Table 62 : Russia Tachometer Market, Revenue & Volume, By Application, 2023-2030 ($)
Table 63 : Israel Tachometer Market, Revenue & Volume, By Type, 2023-2030 ($)
Table 64 : Israel Tachometer Market, Revenue & Volume, By Data Acquisition Technique, 2023-2030 ($)
Table 65 : Israel Tachometer Market, Revenue & Volume, By Measurement Technique, 2023-2030 ($)
Table 66 : Israel Tachometer Market, Revenue & Volume, By Application, 2023-2030 ($)
Table 67 : Top Companies 2023 (US$) Tachometer Market, Revenue & Volume
Table 68 : Product Launch 2023-2030 Tachometer Market, Revenue & Volume
Table 69 : Mergers & Acquistions 2023-2030 Tachometer Market, Revenue & Volume
List of : Figures
Figure 1 : Overview of Tachometer Market 2023-2030
Figure 2 : Market Share Analysis for Tachometer Market 2023 (US$)
Figure 3 : Product Comparison in Tachometer Market 2023-2030 (US$)
Figure 4 : End User Profile for Tachometer Market 2023-2030 (US$)
Figure 5 : Patent Application and Grant in Tachometer Market 2013-2023* (US$)
Figure 6 : Top 5 Companies Financial Analysis in Tachometer Market 2023-2030 (US$)
Figure 7 : Market Entry Strategy in Tachometer Market 2023-2030
Figure 8 : Ecosystem Analysis in Tachometer Market 2023
Figure 9 : Average Selling Price in Tachometer Market 2023-2030
Figure 10 : Top Opportunites in Tachometer Market 2023-2030
Figure 11 : Market Life Cycle Analysis in Tachometer Market
Figure 12 : GlobalBy Type Tachometer Market Revenue, 2023-2030 ($)
Figure 13 : GlobalBy Data Acquisition Technique Tachometer Market Revenue, 2023-2030 ($)
Figure 14 : GlobalBy Measurement Technique Tachometer Market Revenue, 2023-2030 ($)
Figure 15 : GlobalBy Application Tachometer Market Revenue, 2023-2030 ($)
Figure 16 : Global Tachometer Market - By Geography
Figure 17 : Global Tachometer Market Value & Volume, By Geography, 2023-2030 ($)Â
Figure 18 : Global Tachometer Market CAGR, By Geography, 2023-2030 (%)
Figure 19 : North America Tachometer Market Value & Volume, 2023-2030 ($)
Figure 20 : US Tachometer Market Value & Volume, 2023-2030 ($)
Figure 21 : US GDP and Population, 2023-2030 ($)
Figure 22 : US GDP – Composition of 2023, By Sector of Origin
Figure 23 : US Export and Import Value & Volume, 2023-2030 ($)
Figure 24 : Canada Tachometer Market Value & Volume, 2023-2030 ($)
Figure 25 : Canada GDP and Population, 2023-2030 ($)
Figure 26 : Canada GDP – Composition of 2023, By Sector of Origin
Figure 27 : Canada Export and Import Value & Volume, 2023-2030 ($)
Figure 28 : Mexico Tachometer Market Value & Volume, 2023-2030 ($)
Figure 29 : Mexico GDP and Population, 2023-2030 ($)
Figure 30 : Mexico GDP – Composition of 2023, By Sector of Origin
Figure 31 : Mexico Export and Import Value & Volume, 2023-2030 ($)
Figure 32 : South America Tachometer Market Value & Volume, 2023-2030 ($)
Figure 33 : Brazil Tachometer Market Value & Volume, 2023-2030 ($)
Figure 34 : Brazil GDP and Population, 2023-2030 ($)
Figure 35 : Brazil GDP – Composition of 2023, By Sector of Origin
Figure 36 : Brazil Export and Import Value & Volume, 2023-2030 ($)
Figure 37 : Venezuela Tachometer Market Value & Volume, 2023-2030 ($)
Figure 38 : Venezuela GDP and Population, 2023-2030 ($)
Figure 39 : Venezuela GDP – Composition of 2023, By Sector of Origin
Figure 40 : Venezuela Export and Import Value & Volume, 2023-2030 ($)
Figure 41 : Argentina Tachometer Market Value & Volume, 2023-2030 ($)
Figure 42 : Argentina GDP and Population, 2023-2030 ($)
Figure 43 : Argentina GDP – Composition of 2023, By Sector of Origin
Figure 44 : Argentina Export and Import Value & Volume, 2023-2030 ($)
Figure 45 : Ecuador Tachometer Market Value & Volume, 2023-2030 ($)
Figure 46 : Ecuador GDP and Population, 2023-2030 ($)
Figure 47 : Ecuador GDP – Composition of 2023, By Sector of Origin
Figure 48 : Ecuador Export and Import Value & Volume, 2023-2030 ($)
Figure 49 : Peru Tachometer Market Value & Volume, 2023-2030 ($)
Figure 50 : Peru GDP and Population, 2023-2030 ($)
Figure 51 : Peru GDP – Composition of 2023, By Sector of Origin
Figure 52 : Peru Export and Import Value & Volume, 2023-2030 ($)
Figure 53 : Colombia Tachometer Market Value & Volume, 2023-2030 ($)
Figure 54 : Colombia GDP and Population, 2023-2030 ($)
Figure 55 : Colombia GDP – Composition of 2023, By Sector of Origin
Figure 56 : Colombia Export and Import Value & Volume, 2023-2030 ($)
Figure 57 : Costa Rica Tachometer Market Value & Volume, 2023-2030 ($)
Figure 58 : Costa Rica GDP and Population, 2023-2030 ($)
Figure 59 : Costa Rica GDP – Composition of 2023, By Sector of Origin
Figure 60 : Costa Rica Export and Import Value & Volume, 2023-2030 ($)
Figure 61 : Europe Tachometer Market Value & Volume, 2023-2030 ($)
Figure 62 : U.K Tachometer Market Value & Volume, 2023-2030 ($)
Figure 63 : U.K GDP and Population, 2023-2030 ($)
Figure 64 : U.K GDP – Composition of 2023, By Sector of Origin
Figure 65 : U.K Export and Import Value & Volume, 2023-2030 ($)
Figure 66 : Germany Tachometer Market Value & Volume, 2023-2030 ($)
Figure 67 : Germany GDP and Population, 2023-2030 ($)
Figure 68 : Germany GDP – Composition of 2023, By Sector of Origin
Figure 69 : Germany Export and Import Value & Volume, 2023-2030 ($)
Figure 70 : Italy Tachometer Market Value & Volume, 2023-2030 ($)
Figure 71 : Italy GDP and Population, 2023-2030 ($)
Figure 72 : Italy GDP – Composition of 2023, By Sector of Origin
Figure 73 : Italy Export and Import Value & Volume, 2023-2030 ($)
Figure 74 : France Tachometer Market Value & Volume, 2023-2030 ($)
Figure 75 : France GDP and Population, 2023-2030 ($)
Figure 76 : France GDP – Composition of 2023, By Sector of Origin
Figure 77 : France Export and Import Value & Volume, 2023-2030 ($)
Figure 78 : Netherlands Tachometer Market Value & Volume, 2023-2030 ($)
Figure 79 : Netherlands GDP and Population, 2023-2030 ($)
Figure 80 : Netherlands GDP – Composition of 2023, By Sector of Origin
Figure 81 : Netherlands Export and Import Value & Volume, 2023-2030 ($)
Figure 82 : Belgium Tachometer Market Value & Volume, 2023-2030 ($)
Figure 83 : Belgium GDP and Population, 2023-2030 ($)
Figure 84 : Belgium GDP – Composition of 2023, By Sector of Origin
Figure 85 : Belgium Export and Import Value & Volume, 2023-2030 ($)
Figure 86 : Spain Tachometer Market Value & Volume, 2023-2030 ($)
Figure 87 : Spain GDP and Population, 2023-2030 ($)
Figure 88 : Spain GDP – Composition of 2023, By Sector of Origin
Figure 89 : Spain Export and Import Value & Volume, 2023-2030 ($)
Figure 90 : Denmark Tachometer Market Value & Volume, 2023-2030 ($)
Figure 91 : Denmark GDP and Population, 2023-2030 ($)
Figure 92 : Denmark GDP – Composition of 2023, By Sector of Origin
Figure 93 : Denmark Export and Import Value & Volume, 2023-2030 ($)
Figure 94 : APAC Tachometer Market Value & Volume, 2023-2030 ($)
Figure 95 : China Tachometer Market Value & Volume, 2023-2030
Figure 96 : China GDP and Population, 2023-2030 ($)
Figure 97 : China GDP – Composition of 2023, By Sector of Origin
Figure 98 : China Export and Import Value & Volume, 2023-2030 ($) Tachometer Market China Export and Import Value & Volume, 2023-2030 ($)
Figure 99 : Australia Tachometer Market Value & Volume, 2023-2030 ($)
Figure 100 : Australia GDP and Population, 2023-2030 ($)
Figure 101 : Australia GDP – Composition of 2023, By Sector of Origin
Figure 102 : Australia Export and Import Value & Volume, 2023-2030 ($)
Figure 103 : South Korea Tachometer Market Value & Volume, 2023-2030 ($)
Figure 104 : South Korea GDP and Population, 2023-2030 ($)
Figure 105 : South Korea GDP – Composition of 2023, By Sector of Origin
Figure 106 : South Korea Export and Import Value & Volume, 2023-2030 ($)
Figure 107 : India Tachometer Market Value & Volume, 2023-2030 ($)
Figure 108 : India GDP and Population, 2023-2030 ($)
Figure 109 : India GDP – Composition of 2023, By Sector of Origin
Figure 110 : India Export and Import Value & Volume, 2023-2030 ($)
Figure 111 : Taiwan Tachometer Market Value & Volume, 2023-2030 ($)
Figure 112 : Taiwan GDP and Population, 2023-2030 ($)
Figure 113 : Taiwan GDP – Composition of 2023, By Sector of Origin
Figure 114 : Taiwan Export and Import Value & Volume, 2023-2030 ($)
Figure 115 : Malaysia Tachometer Market Value & Volume, 2023-2030 ($)
Figure 116 : Malaysia GDP and Population, 2023-2030 ($)
Figure 117 : Malaysia GDP – Composition of 2023, By Sector of Origin
Figure 118 : Malaysia Export and Import Value & Volume, 2023-2030 ($)
Figure 119 : Hong Kong Tachometer Market Value & Volume, 2023-2030 ($)
Figure 120 : Hong Kong GDP and Population, 2023-2030 ($)
Figure 121 : Hong Kong GDP – Composition of 2023, By Sector of Origin
Figure 122 : Hong Kong Export and Import Value & Volume, 2023-2030 ($)
Figure 123 : Middle East & Africa Tachometer Market Middle East & Africa 3D Printing Market Value & Volume, 2023-2030 ($)
Figure 124 : Russia Tachometer Market Value & Volume, 2023-2030 ($)
Figure 125 : Russia GDP and Population, 2023-2030 ($)
Figure 126 : Russia GDP – Composition of 2023, By Sector of Origin
Figure 127 : Russia Export and Import Value & Volume, 2023-2030 ($)
Figure 128 : Israel Tachometer Market Value & Volume, 2023-2030 ($)
Figure 129 : Israel GDP and Population, 2023-2030 ($)
Figure 130 : Israel GDP – Composition of 2023, By Sector of Origin
Figure 131 : Israel Export and Import Value & Volume, 2023-2030 ($)
Figure 132 : Entropy Share, By Strategies, 2023-2030* (%) Tachometer Market
Figure 133 : Developments, 2023-2030* Tachometer Market
Figure 134 : Company 1 Tachometer Market Net Revenue, By Years, 2023-2030* ($)
Figure 135 : Company 1 Tachometer Market Net Revenue Share, By Business segments, 2023 (%)
Figure 136 : Company 1 Tachometer Market Net Sales Share, By Geography, 2023 (%)
Figure 137 : Company 2 Tachometer Market Net Revenue, By Years, 2023-2030* ($)
Figure 138 : Company 2 Tachometer Market Net Revenue Share, By Business segments, 2023 (%)
Figure 139 : Company 2 Tachometer Market Net Sales Share, By Geography, 2023 (%)
Figure 140 : Company 3 Tachometer Market Net Revenue, By Years, 2023-2030* ($)
Figure 141 : Company 3 Tachometer Market Net Revenue Share, By Business segments, 2023 (%)
Figure 142 : Company 3 Tachometer Market Net Sales Share, By Geography, 2023 (%)
Figure 143 : Company 4 Tachometer Market Net Revenue, By Years, 2023-2030* ($)
Figure 144 : Company 4 Tachometer Market Net Revenue Share, By Business segments, 2023 (%)
Figure 145 : Company 4 Tachometer Market Net Sales Share, By Geography, 2023 (%)
Figure 146 : Company 5 Tachometer Market Net Revenue, By Years, 2023-2030* ($)
Figure 147 : Company 5 Tachometer Market Net Revenue Share, By Business segments, 2023 (%)
Figure 148 : Company 5 Tachometer Market Net Sales Share, By Geography, 2023 (%)
Figure 149 : Company 6 Tachometer Market Net Revenue, By Years, 2023-2030* ($)
Figure 150 : Company 6 Tachometer Market Net Revenue Share, By Business segments, 2023 (%)
Figure 151 : Company 6 Tachometer Market Net Sales Share, By Geography, 2023 (%)
Figure 152 : Company 7 Tachometer Market Net Revenue, By Years, 2023-2030* ($)
Figure 153 : Company 7 Tachometer Market Net Revenue Share, By Business segments, 2023 (%)
Figure 154 : Company 7 Tachometer Market Net Sales Share, By Geography, 2023 (%)
Figure 155 : Company 8 Tachometer Market Net Revenue, By Years, 2023-2030* ($)
Figure 156 : Company 8 Tachometer Market Net Revenue Share, By Business segments, 2023 (%)
Figure 157 : Company 8 Tachometer Market Net Sales Share, By Geography, 2023 (%)
Figure 158 : Company 9 Tachometer Market Net Revenue, By Years, 2023-2030* ($)
Figure 159 : Company 9 Tachometer Market Net Revenue Share, By Business segments, 2023 (%)
Figure 160 : Company 9 Tachometer Market Net Sales Share, By Geography, 2023 (%)
Figure 161 : Company 10 Tachometer Market Net Revenue, By Years, 2023-2030* ($)
Figure 162 : Company 10 Tachometer Market Net Revenue Share, By Business segments, 2023 (%)
Figure 163 : Company 10 Tachometer Market Net Sales Share, By Geography, 2023 (%)
Figure 164 : Company 11 Tachometer Market Net Revenue, By Years, 2023-2030* ($)
Figure 165 : Company 11 Tachometer Market Net Revenue Share, By Business segments, 2023 (%)
Figure 166 : Company 11 Tachometer Market Net Sales Share, By Geography, 2023 (%)
Figure 167 : Company 12 Tachometer Market Net Revenue, By Years, 2023-2030* ($)
Figure 168 : Company 12 Tachometer Market Net Revenue Share, By Business segments, 2023 (%)
Figure 169 : Company 12 Tachometer Market Net Sales Share, By Geography, 2023 (%)
Figure 170 : Company 13 Tachometer Market Net Revenue, By Years, 2023-2030* ($)
Figure 171 : Company 13 Tachometer Market Net Revenue Share, By Business segments, 2023 (%)
Figure 172 : Company 13 Tachometer Market Net Sales Share, By Geography, 2023 (%)
Figure 173 : Company 14 Tachometer Market Net Revenue, By Years, 2023-2030* ($)
Figure 174 : Company 14 Tachometer Market Net Revenue Share, By Business segments, 2023 (%)
Figure 175 : Company 14 Tachometer Market Net Sales Share, By Geography, 2023 (%)
Figure 176 : Company 15 Tachometer Market Net Revenue, By Years, 2023-2030* ($)
Figure 177 : Company 15 Tachometer Market Net Revenue Share, By Business segments, 2023 (%)
Figure 178 : Company 15 Tachometer Market Net Sales Share, By Geography, 2023 (%)
The Tachometer Market is projected to grow at a CAGR of 5.5% during the forecast period 2024-2030.
Global Tachometer Market size is estimated to be $2.1 billion in 2023 and is projected to reach $3 billion by 2030.
The leading players in the Tachometer Market are Dynapar, JTEKT Electronics Corporation, OMRON Corporation, AMETEK Instrumentation Systems, Rockwell Automation, and Others.
Integration of digital technology and Shift towards smart & connected solutions are the major trends in tachometer market.
Increasing number of vehicles sold and Growth in various applications are expected to drive the growth of tachometer market. Develop specialized tachometers for electric vehicles (EVs) and Adapt to the growth of the autonomous vehicle market to create growth opportunities in the market.