 Email
Email Print
Print


Functional Food and Nutraceuticals Market - Forecast(2024 - 2030)
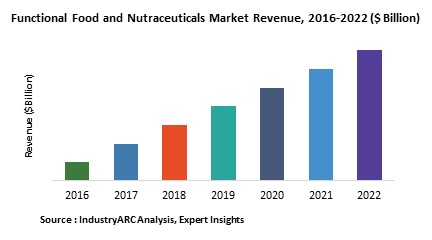
Functional foods are healthy foods that provide benefits beyond basic nutrition. These foods contain naturally enhancing health substances. This feature helps to minimize any health problems and prevent from certain chronic diseases. Functional foods also lower cholesterol level and promote wellness. The word “nutraceutical” is combination of two word “nutrients” and “pharmaceuticals”. Thus, nutraceutical are normal nourishing food sources with medical benefits. The chemical constitution of these products are focused on prevention of diseases and are concentrated in form of liquid, capsule, powder or and other medicine.
The Global Functional Food and Nutraceuticals Market have been classified By Types, Benefits, Origin, Ingredient and Consumers. Food, Beverages and Supplements are classifications for types of Functional Food and Nutraceuticals. On basis of Benefits of this market, it has been divided into Health and Wellness, Disease Prevention, Fitness, Beauty and other advantages. By Origin of Functional Food and Nutraceuticals, it is grouped as Animal and Plant Origins. The main ingredients of these products are Anti-Oxidants, Carotenoids, Fatty Acids, Minerals and other Vitamins. The end-user customers are categorized as Adults, Elders and Children.
The major factors that are fueling the market are rapid growth in food science and technology, individual’s interest in wellness through diet planning, increase in healthcare costs and increase in ageing population.
The entire market has also been segmented based on regions: Americas, Europe, Asia-Pacific (APAC) and RoW. Americas is leading in Functional Food and Nutraceuticals Market followed by Europe and APAC. These regions are also leading consumers of the market to eradicate the rising health issues. APAC is expanding in the market owing to the packaged food industry and emerging growth opportunities in food industry.
Sample Companies Profiled in this Report are:
The quantitative and qualitative data for the Global Functional Food & Nutraceuticals Market report is obtained from various primary and secondary sources. Many interviews and questionnaires were conducted with the senior executives and managers associated with different companies manufacturing these products. Extensive research was done to cover up all the key developments and technology trends to analyze the market. Data have been collected from Farm Equipment Manufacturers Association, Agricultural Engineers Association (AEA), Association of Equipment Manufacturers (AEM) and many others.
The Global Functional Food and Nutraceuticals Market have been classified By Types, Benefits, Origin, Ingredient and Consumers. Food, Beverages and Supplements are classifications for types of Functional Food and Nutraceuticals. On basis of Benefits of this market, it has been divided into Health and Wellness, Disease Prevention, Fitness, Beauty and other advantages. By Origin of Functional Food and Nutraceuticals, it is grouped as Animal and Plant Origins. The main ingredients of these products are Anti-Oxidants, Carotenoids, Fatty Acids, Minerals and other Vitamins. The end-user customers are categorized as Adults, Elders and Children.
The major factors that are fueling the market are rapid growth in food science and technology, individual’s interest in wellness through diet planning, increase in healthcare costs and increase in ageing population.
The entire market has also been segmented based on regions: Americas, Europe, Asia-Pacific (APAC) and RoW. Americas is leading in Functional Food and Nutraceuticals Market followed by Europe and APAC. These regions are also leading consumers of the market to eradicate the rising health issues. APAC is expanding in the market owing to the packaged food industry and emerging growth opportunities in food industry.
Sample Companies Profiled in this Report are:
- Coca Cola Co. (U.S.),
- Danone (France),
- Unilever N.V. (U.K.),
- Nestle S.A. (Switzerland)
- Pepsi Co (U.S.),
- 10+.
The quantitative and qualitative data for the Global Functional Food & Nutraceuticals Market report is obtained from various primary and secondary sources. Many interviews and questionnaires were conducted with the senior executives and managers associated with different companies manufacturing these products. Extensive research was done to cover up all the key developments and technology trends to analyze the market. Data have been collected from Farm Equipment Manufacturers Association, Agricultural Engineers Association (AEA), Association of Equipment Manufacturers (AEM) and many others.
1. Functional Food & Nutraceuticals Market Overview
1.1. Classification
1.2. Type of Product
1.2.1. Foods
1.2.2. Beverages
1.2.3. Nutraceuticals
1.3. Benefit
1.3.1. Weight Management
1.3.2. Beauty
1.3.3. Immunity/Disease Prevention
1.3.4. Energy
1.3.5. General Wellness
1.4. Consumer
1.4.1. Adults
1.4.2. Children
1.4.3. Elders
2. Functional Food & Nutraceuticals Market- Executive Summary
3. Global Functional Food & Nutraceuticals Market Landscape
3.1. Market Share Analysis
3.2. Comparative Analysis
3.2.1. Supplier Benchmarking
3.3. End User Profiling
3.4. Financial Analysis of Top Five Companies
4. Global Functional Food & Nutraceuticals Market Forces
4.1. Market Drivers
4.1.1. Taste and Convenience to Drive Adoption of Functional Foods
4.1.2. Increasing Fitness Consciousness Spurs Market Growth
4.1.3. Rise in Obesityand Its Related Disorders Propel Market for Weight Management
4.2. Market Constraints
4.2.1. Poor Understanding of the Trends Result in Consumer Backlash
4.2.2. Tough Regulations on Labelling Restrain Market Growth
4.3. Market Challenges
4.3.1. Wrong Choice of Ingredients to Dampen Market Growth
4.4. Attractiveness of the Functional Food & Nutraceutical Industry
4.4.1. Power of Suppliers
4.4.2. Power of Customers
4.4.3. Threat of New Entrants
4.4.4. Threat of Substitution
4.4.5. Degree of Competition
5. Functional Food & Nutraceuticals Market- Strategic Analysis
5.1. Value Chain Analysis
5.2. Opportunity Analysis
5.2.1. Consumer Awarness on Efficient Nutrition Aid Market Growth in Africa
6. Functional Food & Nutraceuticals Market – by Type
6.1. Foods
6.1.1. Snacks & Breakfast Cereals
6.1.2. Infant Formula
6.1.3. Bakery & Confectionery
6.1.4. Dairy Products
6.1.5. Others
6.2. Nutraceuticals
6.3. Functional Beverages
6.3.1. Energy Drinks
6.3.2. Sports Drinks/Performance Drinks
6.3.3. Fruit Drinks
6.3.4. Others (Soy Beverages, Enhanced Water, RTD Teas)
7. Functional Food & Nutraceuticals Market – by Benefit
7.1. Weight Management
7.2. Beauty
7.3. Immunity/Disease Prevention
7.4. Energy
7.5. General Wellness
7.6. Others
8. Functional Food & Nutraceuticals Market - by Consumer
8.1. Adults
8.2. Elders
8.3. Children
9. Functional Food & Nutraceuticals Market - Geographic Analysis
9.1. Introduction
9.2. North America
9.2.1. U.S.
9.2.2. Mexico
9.2.3. Canada
9.3. Europe
9.3.1. Germany
9.3.2. U.K.
9.3.3. Italy
9.3.4. France
9.3.5. Rest of Europe
9.4. Asia-Pacific
9.4.1. Japan
9.4.2. China
9.4.3. Australia & Newzealand
9.4.4. India
9.4.5. Rest of APAC
9.5. Row (Rest of the World)
9.5.1. Brazil
9.5.2. Middle East
9.5.3. Others
10. Functional Food & Nutraceuticals Market Entropy
10.1. Introduction
10.1.1. New Product Launches
11. Company Profiles
11.1. Company 1
"*Financials would be provided on a best efforts basis for private companies"
1.1. Classification
1.2. Type of Product
1.2.1. Foods
1.2.2. Beverages
1.2.3. Nutraceuticals
1.3. Benefit
1.3.1. Weight Management
1.3.2. Beauty
1.3.3. Immunity/Disease Prevention
1.3.4. Energy
1.3.5. General Wellness
1.4. Consumer
1.4.1. Adults
1.4.2. Children
1.4.3. Elders
2. Functional Food & Nutraceuticals Market- Executive Summary
3. Global Functional Food & Nutraceuticals Market Landscape
3.1. Market Share Analysis
3.2. Comparative Analysis
3.2.1. Supplier Benchmarking
3.3. End User Profiling
3.4. Financial Analysis of Top Five Companies
4. Global Functional Food & Nutraceuticals Market Forces
4.1. Market Drivers
4.1.1. Taste and Convenience to Drive Adoption of Functional Foods
4.1.2. Increasing Fitness Consciousness Spurs Market Growth
4.1.3. Rise in Obesityand Its Related Disorders Propel Market for Weight Management
4.2. Market Constraints
4.2.1. Poor Understanding of the Trends Result in Consumer Backlash
4.2.2. Tough Regulations on Labelling Restrain Market Growth
4.3. Market Challenges
4.3.1. Wrong Choice of Ingredients to Dampen Market Growth
4.4. Attractiveness of the Functional Food & Nutraceutical Industry
4.4.1. Power of Suppliers
4.4.2. Power of Customers
4.4.3. Threat of New Entrants
4.4.4. Threat of Substitution
4.4.5. Degree of Competition
5. Functional Food & Nutraceuticals Market- Strategic Analysis
5.1. Value Chain Analysis
5.2. Opportunity Analysis
5.2.1. Consumer Awarness on Efficient Nutrition Aid Market Growth in Africa
6. Functional Food & Nutraceuticals Market – by Type
6.1. Foods
6.1.1. Snacks & Breakfast Cereals
6.1.2. Infant Formula
6.1.3. Bakery & Confectionery
6.1.4. Dairy Products
6.1.5. Others
6.2. Nutraceuticals
6.3. Functional Beverages
6.3.1. Energy Drinks
6.3.2. Sports Drinks/Performance Drinks
6.3.3. Fruit Drinks
6.3.4. Others (Soy Beverages, Enhanced Water, RTD Teas)
7. Functional Food & Nutraceuticals Market – by Benefit
7.1. Weight Management
7.2. Beauty
7.3. Immunity/Disease Prevention
7.4. Energy
7.5. General Wellness
7.6. Others
8. Functional Food & Nutraceuticals Market - by Consumer
8.1. Adults
8.2. Elders
8.3. Children
9. Functional Food & Nutraceuticals Market - Geographic Analysis
9.1. Introduction
9.2. North America
9.2.1. U.S.
9.2.2. Mexico
9.2.3. Canada
9.3. Europe
9.3.1. Germany
9.3.2. U.K.
9.3.3. Italy
9.3.4. France
9.3.5. Rest of Europe
9.4. Asia-Pacific
9.4.1. Japan
9.4.2. China
9.4.3. Australia & Newzealand
9.4.4. India
9.4.5. Rest of APAC
9.5. Row (Rest of the World)
9.5.1. Brazil
9.5.2. Middle East
9.5.3. Others
10. Functional Food & Nutraceuticals Market Entropy
10.1. Introduction
10.1.1. New Product Launches
11. Company Profiles
11.1. Company 1
11.2. Company 2
11.3. Company 3
11.4. Company 4
11.5. Company 5
11.6. Company 6
11.7. Company 7
11.8. Company 8
11.9. Company 9
11.10. Company 10
*More than 10 Companies are profiled in this Research Report*"*Financials would be provided on a best efforts basis for private companies"
12. Appendix
12.1. Abbreviations
12.2. Sources
12.3. Research Methodology
12.4. Bibliography
12.5. Compilation of Expert Insights
12.6. Disclaimer
List of Tables
Table 1 Functional Food and Nutraceuticals Market Overview 2023-2030
Table 2 Functional Food and Nutraceuticals Market Leader Analysis 2023-2024 (US$)
Table 3 Functional Food and Nutraceuticals Market Product Analysis 2023-2024 (US$)
Table 4 Functional Food and Nutraceuticals Market End User Analysis 2023-2024 (US$)
Table 5 Functional Food and Nutraceuticals Market Patent Analysis 2021-2023* (US$)
Table 6 Functional Food and Nutraceuticals Market Financial Analysis 2023-2024 (US$)
Table 7 Functional Food and Nutraceuticals Market Driver Analysis 2023-2024 (US$)
Table 8 Functional Food and Nutraceuticals Market Challenges Analysis 2023-2024 (US$)
Table 9 Functional Food and Nutraceuticals Market Constraint Analysis 2023-2024 (US$)
Table 10 Functional Food and Nutraceuticals Market Supplier Bargaining Power Analysis 2023-2024 (US$)
Table 11 Functional Food and Nutraceuticals Market Buyer Bargaining Power Analysis 2023-2024 (US$)
Table 12 Functional Food and Nutraceuticals Market Threat of Substitutes Analysis 2023-2024 (US$)
Table 13 Functional Food and Nutraceuticals Market Threat of New Entrants Analysis 2023-2024 (US$)
Table 14 Functional Food and Nutraceuticals Market Degree of Competition Analysis 2023-2024 (US$)
Table 15 Functional Food and Nutraceuticals Market Value Chain Analysis 2023-2024 (US$)
Table 16 Functional Food and Nutraceuticals Market Pricing Analysis 2023-2030 (US$)
Table 17 Functional Food and Nutraceuticals Market Opportunities Analysis 2023-2030 (US$)
Table 18 Functional Food and Nutraceuticals Market Product Life Cycle Analysis 2023-2030 (US$)
Table 19 Functional Food and Nutraceuticals Market Supplier Analysis 2023-2024 (US$)
Table 20 Functional Food and Nutraceuticals Market Distributor Analysis 2023-2024 (US$)
Table 21 Functional Food and Nutraceuticals Market Trend Analysis 2023-2024 (US$)
Table 22 Functional Food and Nutraceuticals Market Size 2023 (US$)
Table 23 Functional Food and Nutraceuticals Market Forecast Analysis 2023-2030 (US$)
Table 24 Functional Food and Nutraceuticals Market Sales Forecast Analysis 2023-2030 (Units)
Table 25 Functional Food and Nutraceuticals Market, Revenue & Volume,By Type, 2023-2030 ($)
Table 26 Functional Food and Nutraceuticals Market By Type, Revenue & Volume,By Foods, 2023-2030 ($)
Table 27 Functional Food and Nutraceuticals Market By Type, Revenue & Volume,By Snacks & Breakfast Cereals, 2023-2030 ($)
Table 28 Functional Food and Nutraceuticals Market By Type, Revenue & Volume,By Infant Formula, 2023-2030 ($)
Table 29 Functional Food and Nutraceuticals Market By Type, Revenue & Volume,By Bakery & Confectionery, 2023-2030 ($)
Table 30 Functional Food and Nutraceuticals Market By Type, Revenue & Volume,By Dairy Products, 2023-2030 ($)
Table 31 Functional Food and Nutraceuticals Market, Revenue & Volume,By Benefit, 2023-2030 ($)
Table 32 Functional Food and Nutraceuticals Market By Benefit, Revenue & Volume,By Weight Management, 2023-2030 ($)
Table 33 Functional Food and Nutraceuticals Market By Benefit, Revenue & Volume,By Beauty, 2023-2030 ($)
Table 34 Functional Food and Nutraceuticals Market By Benefit, Revenue & Volume,By Immunity/Disease Prevention, 2023-2030 ($)
Table 35 Functional Food and Nutraceuticals Market By Benefit, Revenue & Volume,By Energy, 2023-2030 ($)
Table 36 Functional Food and Nutraceuticals Market By Benefit, Revenue & Volume,By General Wellness, 2023-2030 ($)
Table 37 Functional Food and Nutraceuticals Market, Revenue & Volume,By Consumer, 2023-2030 ($)
Table 38 Functional Food and Nutraceuticals Market By Consumer, Revenue & Volume,By Adults, 2023-2030 ($)
Table 39 Functional Food and Nutraceuticals Market By Consumer, Revenue & Volume,By Elders, 2023-2030 ($)
Table 40 Functional Food and Nutraceuticals Market By Consumer, Revenue & Volume,By Children, 2023-2030 ($)
Table 41 North America Functional Food and Nutraceuticals Market, Revenue & Volume,By Type, 2023-2030 ($)
Table 42 North America Functional Food and Nutraceuticals Market, Revenue & Volume,By Benefit, 2023-2030 ($)
Table 43 North America Functional Food and Nutraceuticals Market, Revenue & Volume,By Consumer, 2023-2030 ($)
Table 44 South america Functional Food and Nutraceuticals Market, Revenue & Volume,By Type, 2023-2030 ($)
Table 45 South america Functional Food and Nutraceuticals Market, Revenue & Volume,By Benefit, 2023-2030 ($)
Table 46 South america Functional Food and Nutraceuticals Market, Revenue & Volume,By Consumer, 2023-2030 ($)
Table 47 Europe Functional Food and Nutraceuticals Market, Revenue & Volume,By Type, 2023-2030 ($)
Table 48 Europe Functional Food and Nutraceuticals Market, Revenue & Volume,By Benefit, 2023-2030 ($)
Table 49 Europe Functional Food and Nutraceuticals Market, Revenue & Volume,By Consumer, 2023-2030 ($)
Table 50 APAC Functional Food and Nutraceuticals Market, Revenue & Volume,By Type, 2023-2030 ($)
Table 51 APAC Functional Food and Nutraceuticals Market, Revenue & Volume,By Benefit, 2023-2030 ($)
Table 52 APAC Functional Food and Nutraceuticals Market, Revenue & Volume,By Consumer, 2023-2030 ($)
Table 53 Middle East & Africa Functional Food and Nutraceuticals Market, Revenue & Volume,By Type, 2023-2030 ($)
Table 54 Middle East & Africa Functional Food and Nutraceuticals Market, Revenue & Volume,By Benefit, 2023-2030 ($)
Table 55 Middle East & Africa Functional Food and Nutraceuticals Market, Revenue & Volume,By Consumer, 2023-2030 ($)
Table 56 Russia Functional Food and Nutraceuticals Market, Revenue & Volume,By Type, 2023-2030 ($)
Table 57 Russia Functional Food and Nutraceuticals Market, Revenue & Volume,By Benefit, 2023-2030 ($)
Table 58 Russia Functional Food and Nutraceuticals Market, Revenue & Volume,By Consumer, 2023-2030 ($)
Table 59 Israel Functional Food and Nutraceuticals Market, Revenue & Volume,By Type, 2023-2030 ($)
Table 60 Israel Functional Food and Nutraceuticals Market, Revenue & Volume,By Benefit, 2023-2030 ($)
Table 61 Israel Functional Food and Nutraceuticals Market, Revenue & Volume,By Consumer, 2023-2030 ($)
Table 62 Top Companies 2023 (US$)Functional Food and Nutraceuticals Market, Revenue & Volume,
Table 63 Product Launch 2023-2024Functional Food and Nutraceuticals Market, Revenue & Volume,
Table 64 Mergers & Acquistions 2023-2024Functional Food and Nutraceuticals Market, Revenue & Volume,
List of Figures
Figure 1 Overview of Functional Food and Nutraceuticals Market 2023-2030
Figure 2 Market Share Analysis for Functional Food and Nutraceuticals Market 2023 (US$)
Figure 3 Product Comparison in Functional Food and Nutraceuticals Market 2023-2024 (US$)
Figure 4 End User Profile for Functional Food and Nutraceuticals Market 2023-2024 (US$)
Figure 5 Patent Application and Grant in Functional Food and Nutraceuticals Market 2021-2023* (US$)
Figure 6 Top 5 Companies Financial Analysis in Functional Food and Nutraceuticals Market 2023-2024 (US$)
Figure 7 Market Entry Strategy in Functional Food and Nutraceuticals Market 2023-2024
Figure 8 Ecosystem Analysis in Functional Food and Nutraceuticals Market 2023
Figure 9 Average Selling Price in Functional Food and Nutraceuticals Market 2023-2030
Figure 10 Top Opportunites in Functional Food and Nutraceuticals Market 2023-2024
Figure 11 Market Life Cycle Analysis in Functional Food and Nutraceuticals Market
Figure 12 GlobalBy TypeFunctional Food and Nutraceuticals Market Revenue, 2023-2030 ($)
Figure 13 GlobalBy BenefitFunctional Food and Nutraceuticals Market Revenue, 2023-2030 ($)
Figure 14 GlobalBy ConsumerFunctional Food and Nutraceuticals Market Revenue, 2023-2030 ($)
Figure 15 Global Functional Food and Nutraceuticals Market - By Geography
Figure 16 Global Functional Food and Nutraceuticals Market Value & Volume, By Geography, 2023-2030 ($)
Figure 17 Global Functional Food and Nutraceuticals Market CAGR, By Geography, 2023-2030 (%)
Figure 18 North America Functional Food and Nutraceuticals Market Value & Volume, 2023-2030 ($)
Figure 19 US Functional Food and Nutraceuticals Market Value & Volume, 2023-2030 ($)
Figure 20 US GDP and Population, 2023-2024 ($)
Figure 21 US GDP – Composition of 2023, By Sector of Origin
Figure 22 US Export and Import Value & Volume, 2023-2024 ($)
Figure 23 Canada Functional Food and Nutraceuticals Market Value & Volume, 2023-2030 ($)
Figure 24 Canada GDP and Population, 2023-2024 ($)
Figure 25 Canada GDP – Composition of 2023, By Sector of Origin
Figure 26 Canada Export and Import Value & Volume, 2023-2024 ($)
Figure 27 Mexico Functional Food and Nutraceuticals Market Value & Volume, 2023-2030 ($)
Figure 28 Mexico GDP and Population, 2023-2024 ($)
Figure 29 Mexico GDP – Composition of 2023, By Sector of Origin
Figure 30 Mexico Export and Import Value & Volume, 2023-2024 ($)
Figure 31 South America Functional Food and Nutraceuticals Market Value & Volume, 2023-2030 ($)
Figure 32 Brazil Functional Food and Nutraceuticals Market Value & Volume, 2023-2030 ($)
Figure 33 Brazil GDP and Population, 2023-2024 ($)
Figure 34 Brazil GDP – Composition of 2023, By Sector of Origin
Figure 35 Brazil Export and Import Value & Volume, 2023-2024 ($)
Figure 36 Venezuela Functional Food and Nutraceuticals Market Value & Volume, 2023-2030 ($)
Figure 37 Venezuela GDP and Population, 2023-2024 ($)
Figure 38 Venezuela GDP – Composition of 2023, By Sector of Origin
Figure 39 Venezuela Export and Import Value & Volume, 2023-2024 ($)
Figure 40 Argentina Functional Food and Nutraceuticals Market Value & Volume, 2023-2030 ($)
Figure 41 Argentina GDP and Population, 2023-2024 ($)
Figure 42 Argentina GDP – Composition of 2023, By Sector of Origin
Figure 43 Argentina Export and Import Value & Volume, 2023-2024 ($)
Figure 44 Ecuador Functional Food and Nutraceuticals Market Value & Volume, 2023-2030 ($)
Figure 45 Ecuador GDP and Population, 2023-2024 ($)
Figure 46 Ecuador GDP – Composition of 2023, By Sector of Origin
Figure 47 Ecuador Export and Import Value & Volume, 2023-2024 ($)
Figure 48 Peru Functional Food and Nutraceuticals Market Value & Volume, 2023-2030 ($)
Figure 49 Peru GDP and Population, 2023-2024 ($)
Figure 50 Peru GDP – Composition of 2023, By Sector of Origin
Figure 51 Peru Export and Import Value & Volume, 2023-2024 ($)
Figure 52 Colombia Functional Food and Nutraceuticals Market Value & Volume, 2023-2030 ($)
Figure 53 Colombia GDP and Population, 2023-2024 ($)
Figure 54 Colombia GDP – Composition of 2023, By Sector of Origin
Figure 55 Colombia Export and Import Value & Volume, 2023-2024 ($)
Figure 56 Costa Rica Functional Food and Nutraceuticals Market Value & Volume, 2023-2030 ($)
Figure 57 Costa Rica GDP and Population, 2023-2024 ($)
Figure 58 Costa Rica GDP – Composition of 2023, By Sector of Origin
Figure 59 Costa Rica Export and Import Value & Volume, 2023-2024 ($)
Figure 60 Europe Functional Food and Nutraceuticals Market Value & Volume, 2023-2030 ($)
Figure 61 U.K Functional Food and Nutraceuticals Market Value & Volume, 2023-2030 ($)
Figure 62 U.K GDP and Population, 2023-2024 ($)
Figure 63 U.K GDP – Composition of 2023, By Sector of Origin
Figure 64 U.K Export and Import Value & Volume, 2023-2024 ($)
Figure 65 Germany Functional Food and Nutraceuticals Market Value & Volume, 2023-2030 ($)
Figure 66 Germany GDP and Population, 2023-2024 ($)
Figure 67 Germany GDP – Composition of 2023, By Sector of Origin
Figure 68 Germany Export and Import Value & Volume, 2023-2024 ($)
Figure 69 Italy Functional Food and Nutraceuticals Market Value & Volume, 2023-2030 ($)
Figure 70 Italy GDP and Population, 2023-2024 ($)
Figure 71 Italy GDP – Composition of 2023, By Sector of Origin
Figure 72 Italy Export and Import Value & Volume, 2023-2024 ($)
Figure 73 France Functional Food and Nutraceuticals Market Value & Volume, 2023-2030 ($)
Figure 74 France GDP and Population, 2023-2024 ($)
Figure 75 France GDP – Composition of 2023, By Sector of Origin
Figure 76 France Export and Import Value & Volume, 2023-2024 ($)
Figure 77 Netherlands Functional Food and Nutraceuticals Market Value & Volume, 2023-2030 ($)
Figure 78 Netherlands GDP and Population, 2023-2024 ($)
Figure 79 Netherlands GDP – Composition of 2023, By Sector of Origin
Figure 80 Netherlands Export and Import Value & Volume, 2023-2024 ($)
Figure 81 Belgium Functional Food and Nutraceuticals Market Value & Volume, 2023-2030 ($)
Figure 82 Belgium GDP and Population, 2023-2024 ($)
Figure 83 Belgium GDP – Composition of 2023, By Sector of Origin
Figure 84 Belgium Export and Import Value & Volume, 2023-2024 ($)
Figure 85 Spain Functional Food and Nutraceuticals Market Value & Volume, 2023-2030 ($)
Figure 86 Spain GDP and Population, 2023-2024 ($)
Figure 87 Spain GDP – Composition of 2023, By Sector of Origin
Figure 88 Spain Export and Import Value & Volume, 2023-2024 ($)
Figure 89 Denmark Functional Food and Nutraceuticals Market Value & Volume, 2023-2030 ($)
Figure 90 Denmark GDP and Population, 2023-2024 ($)
Figure 91 Denmark GDP – Composition of 2023, By Sector of Origin
Figure 92 Denmark Export and Import Value & Volume, 2023-2024 ($)
Figure 93 APAC Functional Food and Nutraceuticals Market Value & Volume, 2023-2030 ($)
Figure 94 China Functional Food and Nutraceuticals Market Value & Volume, 2023-2030
Figure 95 China GDP and Population, 2023-2024 ($)
Figure 96 China GDP – Composition of 2023, By Sector of Origin
Figure 97 China Export and Import Value & Volume, 2023-2024 ($)Functional Food and Nutraceuticals Market China Export and Import Value & Volume, 2023-2024 ($)
Figure 98 Australia Functional Food and Nutraceuticals Market Value & Volume, 2023-2030 ($)
Figure 99 Australia GDP and Population, 2023-2024 ($)
Figure 100 Australia GDP – Composition of 2023, By Sector of Origin
Figure 101 Australia Export and Import Value & Volume, 2023-2024 ($)
Figure 102 South Korea Functional Food and Nutraceuticals Market Value & Volume, 2023-2030 ($)
Figure 103 South Korea GDP and Population, 2023-2024 ($)
Figure 104 South Korea GDP – Composition of 2023, By Sector of Origin
Figure 105 South Korea Export and Import Value & Volume, 2023-2024 ($)
Figure 106 India Functional Food and Nutraceuticals Market Value & Volume, 2023-2030 ($)
Figure 107 India GDP and Population, 2023-2024 ($)
Figure 108 India GDP – Composition of 2023, By Sector of Origin
Figure 109 India Export and Import Value & Volume, 2023-2024 ($)
Figure 110 Taiwan Functional Food and Nutraceuticals Market Value & Volume, 2023-2030 ($)
Figure 111 Taiwan GDP and Population, 2023-2024 ($)
Figure 112 Taiwan GDP – Composition of 2023, By Sector of Origin
Figure 113 Taiwan Export and Import Value & Volume, 2023-2024 ($)
Figure 114 Malaysia Functional Food and Nutraceuticals Market Value & Volume, 2023-2030 ($)
Figure 115 Malaysia GDP and Population, 2023-2024 ($)
Figure 116 Malaysia GDP – Composition of 2023, By Sector of Origin
Figure 117 Malaysia Export and Import Value & Volume, 2023-2024 ($)
Figure 118 Hong Kong Functional Food and Nutraceuticals Market Value & Volume, 2023-2030 ($)
Figure 119 Hong Kong GDP and Population, 2023-2024 ($)
Figure 120 Hong Kong GDP – Composition of 2023, By Sector of Origin
Figure 121 Hong Kong Export and Import Value & Volume, 2023-2024 ($)
Figure 122 Middle East & Africa Functional Food and Nutraceuticals Market Middle East & Africa 3D Printing Market Value & Volume, 2023-2030 ($)
Figure 123 Russia Functional Food and Nutraceuticals Market Value & Volume, 2023-2030 ($)
Figure 124 Russia GDP and Population, 2023-2024 ($)
Figure 125 Russia GDP – Composition of 2023, By Sector of Origin
Figure 126 Russia Export and Import Value & Volume, 2023-2024 ($)
Figure 127 Israel Functional Food and Nutraceuticals Market Value & Volume, 2023-2030 ($)
Figure 128 Israel GDP and Population, 2023-2024 ($)
Figure 129 Israel GDP – Composition of 2023, By Sector of Origin
Figure 130 Israel Export and Import Value & Volume, 2023-2024 ($)
Figure 131 Entropy Share, By Strategies, 2023-2024* (%)Functional Food and Nutraceuticals Market
Figure 132 Developments, 2023-2024*Functional Food and Nutraceuticals Market
Figure 133 Company 1 Functional Food and Nutraceuticals Market Net Revenue, By Years, 2023-2024* ($)
Figure 134 Company 1 Functional Food and Nutraceuticals Market Net Revenue Share, By Business segments, 2023 (%)
Figure 135 Company 1 Functional Food and Nutraceuticals Market Net Sales Share, By Geography, 2023 (%)
Figure 136 Company 2 Functional Food and Nutraceuticals Market Net Revenue, By Years, 2023-2024* ($)
Figure 137 Company 2 Functional Food and Nutraceuticals Market Net Revenue Share, By Business segments, 2023 (%)
Figure 138 Company 2 Functional Food and Nutraceuticals Market Net Sales Share, By Geography, 2023 (%)
Figure 139 Company 3Functional Food and Nutraceuticals Market Net Revenue, By Years, 2023-2024* ($)
Figure 140 Company 3Functional Food and Nutraceuticals Market Net Revenue Share, By Business segments, 2023 (%)
Figure 141 Company 3Functional Food and Nutraceuticals Market Net Sales Share, By Geography, 2023 (%)
Figure 142 Company 4 Functional Food and Nutraceuticals Market Net Revenue, By Years, 2023-2024* ($)
Figure 143 Company 4 Functional Food and Nutraceuticals Market Net Revenue Share, By Business segments, 2023 (%)
Figure 144 Company 4 Functional Food and Nutraceuticals Market Net Sales Share, By Geography, 2023 (%)
Figure 145 Company 5 Functional Food and Nutraceuticals Market Net Revenue, By Years, 2023-2024* ($)
Figure 146 Company 5 Functional Food and Nutraceuticals Market Net Revenue Share, By Business segments, 2023 (%)
Figure 147 Company 5 Functional Food and Nutraceuticals Market Net Sales Share, By Geography, 2023 (%)
Figure 148 Company 6 Functional Food and Nutraceuticals Market Net Revenue, By Years, 2023-2024* ($)
Figure 149 Company 6 Functional Food and Nutraceuticals Market Net Revenue Share, By Business segments, 2023 (%)
Figure 150 Company 6 Functional Food and Nutraceuticals Market Net Sales Share, By Geography, 2023 (%)
Figure 151 Company 7 Functional Food and Nutraceuticals Market Net Revenue, By Years, 2023-2024* ($)
Figure 152 Company 7 Functional Food and Nutraceuticals Market Net Revenue Share, By Business segments, 2023 (%)
Figure 153 Company 7 Functional Food and Nutraceuticals Market Net Sales Share, By Geography, 2023 (%)
Figure 154 Company 8 Functional Food and Nutraceuticals Market Net Revenue, By Years, 2023-2024* ($)
Figure 155 Company 8 Functional Food and Nutraceuticals Market Net Revenue Share, By Business segments, 2023 (%)
Figure 156 Company 8 Functional Food and Nutraceuticals Market Net Sales Share, By Geography, 2023 (%)
Figure 157 Company 9 Functional Food and Nutraceuticals Market Net Revenue, By Years, 2023-2024* ($)
Figure 158 Company 9 Functional Food and Nutraceuticals Market Net Revenue Share, By Business segments, 2023 (%)
Figure 159 Company 9 Functional Food and Nutraceuticals Market Net Sales Share, By Geography, 2023 (%)
Figure 160 Company 10 Functional Food and Nutraceuticals Market Net Revenue, By Years, 2023-2024* ($)
Figure 161 Company 10 Functional Food and Nutraceuticals Market Net Revenue Share, By Business segments, 2023 (%)
Figure 162 Company 10 Functional Food and Nutraceuticals Market Net Sales Share, By Geography, 2023 (%)
Figure 163 Company 11 Functional Food and Nutraceuticals Market Net Revenue, By Years, 2023-2024* ($)
Figure 164 Company 11 Functional Food and Nutraceuticals Market Net Revenue Share, By Business segments, 2023 (%)
Figure 165 Company 11 Functional Food and Nutraceuticals Market Net Sales Share, By Geography, 2023 (%)
Figure 166 Company 12 Functional Food and Nutraceuticals Market Net Revenue, By Years, 2023-2024* ($)
Figure 167 Company 12 Functional Food and Nutraceuticals Market Net Revenue Share, By Business segments, 2023 (%)
Figure 168 Company 12 Functional Food and Nutraceuticals Market Net Sales Share, By Geography, 2023 (%)
Figure 169 Company 13Functional Food and Nutraceuticals Market Net Revenue, By Years, 2023-2024* ($)
Figure 170 Company 13Functional Food and Nutraceuticals Market Net Revenue Share, By Business segments, 2023 (%)
Figure 171 Company 13Functional Food and Nutraceuticals Market Net Sales Share, By Geography, 2023 (%)
Figure 172 Company 14 Functional Food and Nutraceuticals Market Net Revenue, By Years, 2023-2024* ($)
Figure 173 Company 14 Functional Food and Nutraceuticals Market Net Revenue Share, By Business segments, 2023 (%)
Figure 174 Company 14 Functional Food and Nutraceuticals Market Net Sales Share, By Geography, 2023 (%)
Figure 175 Company 15 Functional Food and Nutraceuticals Market Net Revenue, By Years, 2023-2024* ($)
Figure 176 Company 15 Functional Food and Nutraceuticals Market Net Revenue Share, By Business segments, 2023 (%)
Figure 177 Company 15 Functional Food and Nutraceuticals Market Net Sales Share, By Geography, 2023 (%)